Resources
About Us
Venous Thromboembolism Treatment Market by Device (Thrombectomy, Inferior Vena Cava Filter [Retrievable, Permanent], Stockings, Compression Pump) Application (DVT, Pulmonary Embolism) End User (Hospital, Ambulatory Care Center) – Global Forecast to 2030
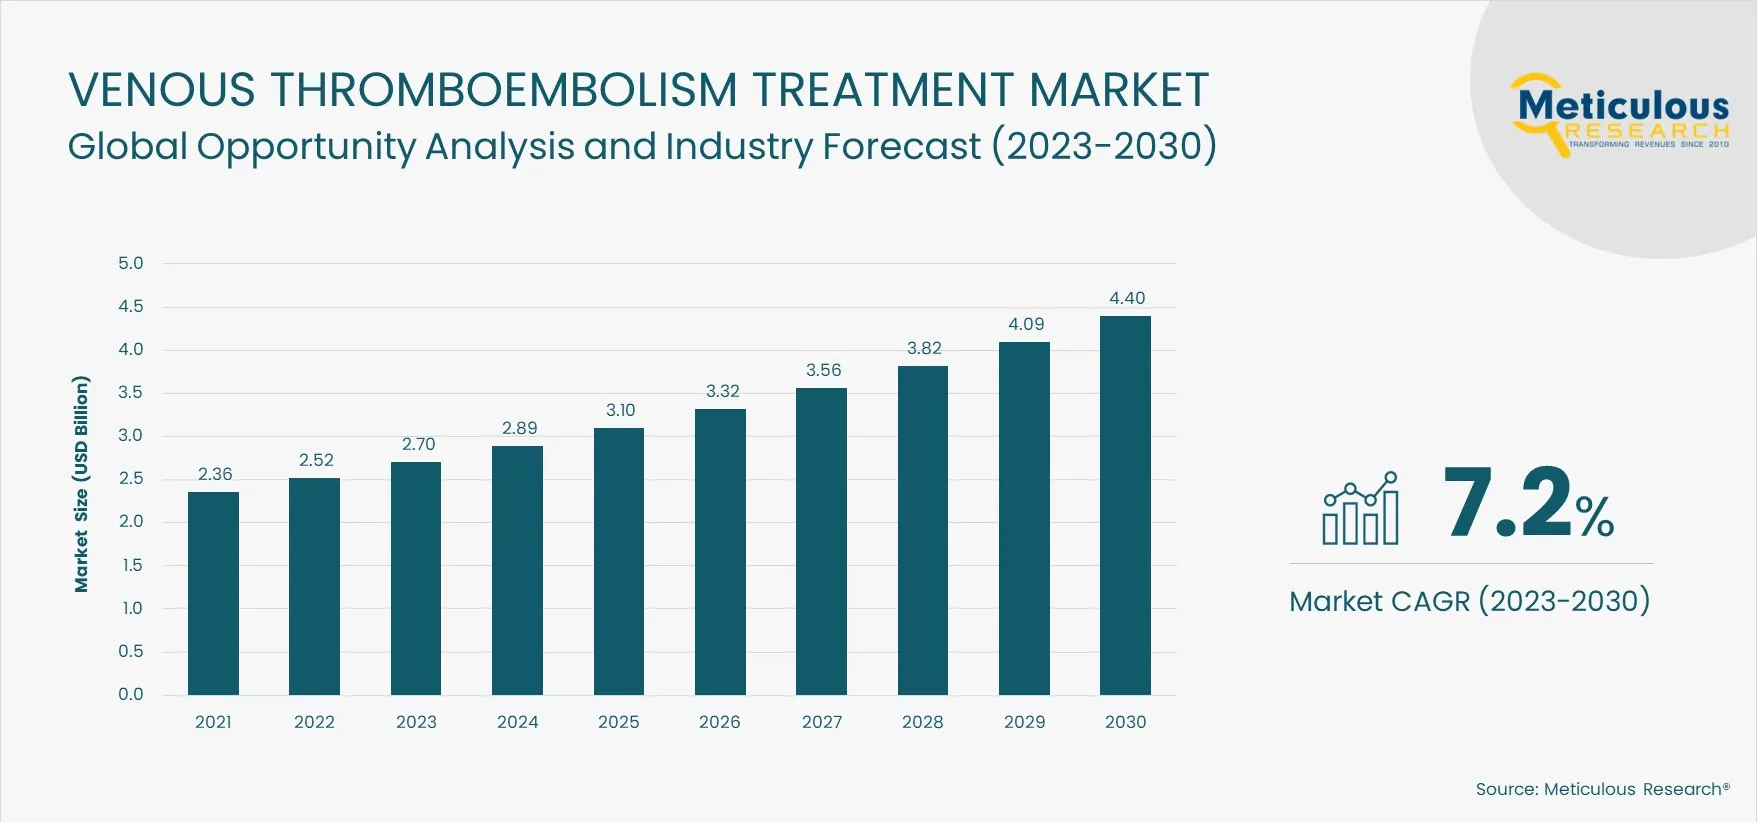
Report ID: MRHC - 1041062 Pages: 158 Dec-2023 Formats*: PDF Category: Healthcare Delivery: 2 to 4 Hours Download Free Sample ReportThe Venous Thromboembolism Treatment Market is projected to reach $4.40 billion by 2030, at a CAGR of 7.2% from 2023 to 2030. Venous thromboembolism occurs when a blood clot forms in a vein, obstructing the blood flow and posing a potentially life-threatening risk. Several devices and drugs are employed for the prevention and treatment of venous thromboembolism. The devices considered within this scope are utilized for both the prevention and treatment of venous thromboembolism and encompass compression pumps, thrombectomy devices, inferior vena cava filters, and stockings, among others.
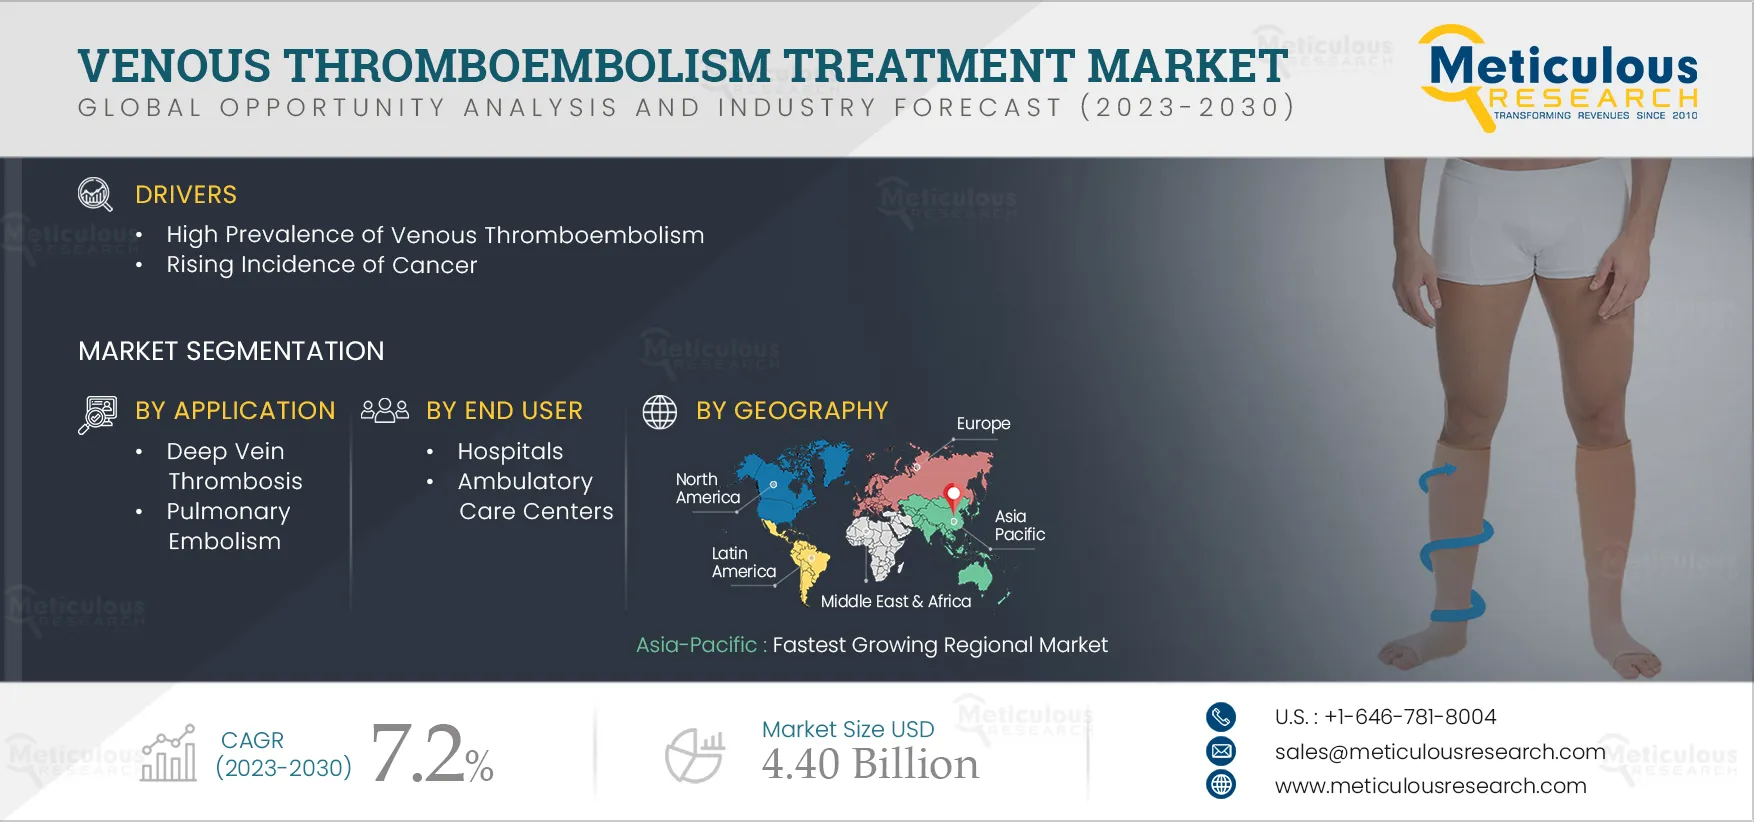
The high prevalence of venous thromboembolism, rising incidence of cancer, growing prevalence of secondary risk factors such as diabetes and obesity, increase in orthopedic surgical procedures, and the rising demand for minimally invasive treatment procedures are the key factors driving the growth of the venous thromboembolism treatment market. Furthermore, the growing accessibility and affordability of treatment options, advancements in VTE diagnosis and treatment methods, and the market expansion in emerging economies are expected to create market growth opportunities.
However, instances of product failure and product recalls may restrain the market’s growth. Additionally, lack of awareness about venous thromboembolism and increasing awareness of probable side effects of compression garments are major challenges for market growth.
In recent years, there have been significant advances in VTE diagnosis, prevention, treatment, and management. Noninvasive imaging modalities, D-dimer testing, and clinical prediction rules allow for the quick, economical, and accurate diagnosis of VTE. Recent advances include the use of AI-guided software in the diagnosis of VTE. AI-based detection is quicker compared to traditional diagnosis methods. Healthcare AI companies are also focused on launching AI-powered diagnosis solutions. For instance, in November 2021, Viz.ai, Inc. (U.S.) launched AI-powered modules for the diagnosis of pulmonary embolism and aortic disease. Viz.ai’s solution uses deep learning to identify suspected pulmonary embolism disease in under two minutes.
Thrombectomy devices are widely used for the treatment of VTE. Key players are integrating advanced technologies into their thrombectomy devices for more efficient removal of thrombi. For instance, in January 2023, Penumbra, Inc. (U.S.) launched and received FDA approval for Lightning Flash, a mechanical thrombectomy system designed to quickly remove large blood clots, including venous thrombus and pulmonary emboli (PE). Lightning Flash is based on Penumbra’s novel Lightning Intelligent Aspiration technology featuring dual clot detection algorithms.
Furthermore, in July 2021, AngioDynamics, Inc. (U.S.) received 510 (k) clearance from the FDA for its AlphaVac Mechanical Thrombectomy System, which is an off-circuit and multipurpose thrombectomy device used for the nonsurgical removal of thrombi or emboli from the vasculature. Such advancements in VTE diagnosis and treatment techniques are expected to create market growth opportunities during the forecast period.
Growing Accessibility and Affordability of Treatment Options to Offer Growth Opportunities to Market Players
Access to VTE treatments is increasing due to the rising disposable incomes and growing awareness about the importance of early disease treatment. Government agencies are launching health campaigns to raise awareness about venous thromboembolism. For instance, the International Society on Thrombosis and Haemostasis (ISTH) (U.S.) conducted a global campaign on 13th October 2023 to raise awareness regarding conditions caused by thrombosis, a disorder responsible for one in four deaths worldwide. Most health insurance companies and Medicare cover DVT treatment costs, contributing to the affordability of VTE treatments.
There is a notable transition in the treatment of VTE from traditional hospital settings to outpatient environments, including ambulatory care and home care settings. This shift is largely driven by the cost-effectiveness of outpatient settings compared to hospitals. Expenses such as nursing costs, hospital stays, and laboratory services are generally lower in outpatient settings, enhancing the affordability of venous thromboembolism treatments for patients. This trend opens up growth opportunities for players operating in this space.
The Thrombectomy Devices Segment is Expected to Account for the Largest Share of the Market in 2023
Based on device, the venous thromboembolism treatment market is segmented into thrombectomy devices, inferior vena cava filters, stockings, compression pumps, and other devices & accessories. In 2023, the thrombectomy devices segment is expected to account for the largest share of the market. The main factors contributing to the large market share of this segment are the increasing prevalence of cardiovascular diseases, growing preference for minimally invasive procedures, and launches of new thrombectomy devices. Thrombectomy devices are employed in the treatment of venous thromboembolism (VTE), acute stroke, pulmonary embolism (PE), and deep vein thrombosis (DVT). Venous thrombectomy is performed in patients with severe cases of DVT that may lead to PE. According to various research studies, approximately 13-31% of critically ill patients develop DVT, which requires interventional procedures like thrombectomy.
The Deep Vein Thrombosis Segment is Expected to Account for the Largest Share of the Market in 2023
Based on application, the venous thromboembolism treatment market is segmented into deep vein thrombosis and pulmonary embolism. In 2023, the deep vein thrombosis (DVT) segment is expected to account for the largest share of the market. The large market share of this segment is attributed to the increasing prevalence of obesity, a growing geriatric population, rising cases of deep vein thrombosis due to lifestyle-related diseases, excessive alcohol consumption, and heightened awareness of DVT.
The Hospitals Segment is Expected to Account for the Largest Share of the Market in 2023
Based on end user, the venous thromboembolism treatment market is segmented into hospitals, ambulatory care centers, and other end users. In 2023, the hospitals segment is expected to account for the largest share of the market. The large market share is attributed to the increasing prevalence of venous thromboembolism, the rising number of hospitals and clinics, the presence of highly skilled professionals, and the high purchasing power of hospitals. The easy accessibility to hospitals, coupled with a large patient population seeking comprehensive healthcare services, including diagnosis, treatment, and surgeries at a single location, also contributes to the significant market share of this segment.
Asia-Pacific: Fastest Growing Regional Market
Asia-Pacific is slated to register the highest CAGR in the venous thromboembolism treatment market during the forecast period. The growth of this regional market can be attributed to factors such as the growing prevalence of chronic diseases, the increasing number of people living sedentary lifestyles, growing health expenditures, supportive government initiatives aimed at improving healthcare infrastructure, and rising awareness regarding venous thromboembolism.
Key Players
The report includes a competitive landscape based on an extensive assessment of the key growth strategies adopted by leading market participants over the past three to four years. The key players operating in the global venous thromboembolism treatment market are ALN Implants chirurgicaux (ALN Surgical Implants) (France), AngioDynamics, Inc. (U.S.), Argon Medical Devices, Inc. (U.S.), ArjoHuntleigh AB (Sweden), Boston Scientific Corporation (U.S.), Cardinal Health, Inc. (U.S.), Cook Group Incorporated (U.S.), Koninklijke Philips N.V. (Netherlands), DS MAREF Co., LTD (South Korea), Enovis Corporation (U.S.), LifeTech Scientific Corporation (China), Medtronic plc (Ireland), and Stryker Corporation (U.S.).
Report Summary:
Particular |
Details |
Page No |
157 |
Format |
|
Forecast Period |
2023-2030 |
Base Year |
2023 |
CAGR |
7.2% |
Market Size (Value) |
$4.40 billion |
Market Size (Volume) |
NA |
Segments Covered |
Device, Application, and End User |
Countries Covered |
North America (U.S., Canada), Europe (Germany, France, U.K., Italy, Spain, Rest of Europe), Asia-Pacific (China, Japan, India, Rest of Asia-Pacific), Latin America, and the Middle East & Africa. |
Key Companies |
ALN Implants chirurgicaux (ALN Surgical Implants) (France), AngioDynamics, Inc. (U.S.), Argon Medical Devices, Inc. (U.S.), ArjoHuntleigh AB (Sweden), Boston Scientific Corporation (U.S.), Cardinal Health, Inc. (U.S.), Cook Group Incorporated (U.S.), Koninklijke Philips N.V. (Netherlands), DS MAREF Co., LTD (South Korea), Enovis Corporation (U.S.), LifeTech Scientific Corporation (China), Medtronic plc (Ireland), and Stryker Corporation (U.S.) |
Scope of the Report:
Venous Thromboembolism Treatment Market Assessment, by Device
Venous Thromboembolism Treatment Market Assessment,by Application
Venous Thromboembolism Treatment Market Assessment, by End User
Venous Thromboembolism Treatment Market, by Geography
Key questions answered in the report:
This study offers a detailed assessment of the venous thromboembolism treatment market, including the market sizes & forecasts for various segmentations like device, application, and end user. The venous thromboembolism treatment market report also involves the value analysis of the market at the regional and country levels.
The global venous thromboembolism treatment market is projected to reach $4.40 billion by 2030, at a CAGR of 7.2% during the forecast period.
Based on device, the venous thromboembolism treatment market is segmented into thrombectomy devices, inferior vena cava filters, stockings, compression pumps, and other devices & accessories. In 2023, the thrombectomy devices segment is expected to account for the largest share of the market.
Based on application, in 2023, the deep vein thrombosis segment is expected to account for the largest share of the market. The large market share of this segment is attributed to the increasing geriatric population, rising cases of obesity, increasing cases of deep vein thrombosis due to disease-causing lifestyle, excessive alcohol consumption, and the growing awareness and early diagnosis of DVT.
The high prevalence of venous thromboembolism, rising incidence of cancer, growing prevalence of secondary risk factors such as diabetes and obesity, increase in orthopedic surgical procedures, and the rising demand for minimally invasive treatment procedures are the key factors driving the growth of the venous thromboembolism treatment market. Furthermore, the growing accessibility and affordability of treatment options, advancements in VTE diagnosis and treatment methods, and the market expansion in emerging economies are expected to create market growth opportunities.
The key players operating in the global venous thromboembolism treatment market are ALN Implants chirurgicaux (ALN Surgical Implants) (France), AngioDynamics, Inc. (U.S.), Argon Medical Devices, Inc. (U.S.), ArjoHuntleigh AB (Sweden), Boston Scientific Corporation (U.S.), Cardinal Health, Inc. (U.S.), Cook Group Incorporated (U.S.), Koninklijke Philips N.V. (Netherlands), DS MAREF Co., LTD (South Korea), Enovis Corporation (U.S.), LifeTech Scientific Corporation (China), Medtronic plc (Ireland), and Stryker Corporation (U.S.).
Emerging economies such as China and India are expected to provide significant growth opportunities for players operating in this market.
1. Introduction
1.1. Market Definition & Scope
1.2. Market Ecosystem
1.3. Currency & Limitations
1.4. Key Stakeholders
2. Research Methodology
2.1. Research Process
2.2. Process of Data Collection & Validation
2.2.1. Secondary Research
2.2.2. Primary Research/Interviews With Key Opinion Leaders of the Industry
2.3. Market Sizing and Forecasting
2.3.1. Market Size Estimation
2.3.1.1. Bottom-Up Approach
2.3.1.2. Top-Down Approach
2.3.1.3. Growth Forecast Approach
2.3.2. Market Share Analysis
2.4. Assumptions for the Study
3. Executive Summary
4. Market Insights
4.1. Overview
4.2. Drivers
4.2.1. High Prevalence of Venous Thromboembolism
4.2.2. Rising Incidence of Cancer
4.3. Restraints
4.3.1. Instances of Product Failure and Product Recalls
4.4. Opportunities
4.4.1. Growing Accessibility and Affordability of Treatment Options
4.4.2. Advancements in VTE Diagnosis and Treatment Methods
4.5. Challenges
4.5.1. Lack of Awareness About Venous Thromboembolism
5. Venous Thromboembolism Treatment Market Assessment—by Device
5.1. Overview
5.2. Thrombectomy Devices
5.3. Inferior Vena Cava Filters
5.3.1. Retrievable Filters
5.3.2. Permanent Filters
5.4. Stockings
5.5. Compression Pumps
5.6. Other Devices & Accessories
6. Venous Thromboembolism Treatment Market Assessment—by Application
6.1. Overview
6.2. Deep Vein Thrombosis (DVT)
6.3. Pulmonary Embolism (PE)
7. Venous Thromboembolism Treatment Market Assessment—by End User
7.1. Overview
7.2. Hospitals
7.3. Ambulatory Care Centers
7.4. Other End Users
8. Venous Thromboembolism Treatment Market Assessment—by Geography
8.1. Overview
8.2. North America
8.2.1. U.S.
8.2.2. Canada
8.3. Europe
8.3.1. Germany
8.3.2. France
8.3.3. U.K.
8.3.4. Italy
8.3.5. Spain
8.3.6. Rest of Europe
8.4. Asia-Pacific
8.4.1. China
8.4.2. Japan
8.4.3. India
8.4.4. Rest of Asia-Pacific
8.5. Latin America
8.6. Middle East & Africa
9. Competition Analysis
9.1. Overview
9.2. Key Growth Strategies
9.3. Competitive Benchmarking
9.4. Competitive Dashboard
9.4.1. Industry Leaders
9.4.2. Market Differentiators
9.4.3. Vanguards
9.4.4. Emerging Companies
9.5. Market Share Analysis (2022)
9.5.1. Boston Scientific Corporation (U.S.)
9.5.2. Stryker Corporation (U.S.)
9.5.3. Cardinal Health, Inc. (U.S.)
9.5.4. Enovis Corporation (U.S.)
9.5.5. Medtronic plc (Ireland)
9.5.6. Cook Group Incorporated (U.S.)
10. Company Profiles
10.1. ALN Implants chirurgicaux (ALN Surgical Implants)
10.2. AngioDynamics, Inc.
10.3. Argon Medical Devices, Inc.
10.4. ArjoHuntleigh AB
10.5. Boston Scientific Corporation
10.6. Cardinal Health, Inc.
10.7. Cook Group Incorporated
10.8. Koninklijke Philips N.V.
10.9. DS MAREF Co., Ltd
10.10. Enovis Corporation
10.11. LifeTech Scientific Corporation
10.12. Medtronic plc
10.13. Stryker Corporation
11. Appendix
11.1. Available Customization
11.2. Related Reports
List of Tables
Table 1 Share of Population Aged 65 Years or Above, by Region, 2022 Vs. 2030 Vs. 2050
Table 2 Number of New Cancer Cases, by Type, 2020 Vs. 2030
Table 3 Global Venous Thromboembolism Treatment Market, by Device, 2021–2030 (USD Million)
Table 4 Global Venous Thromboembolism Treatment Market for Thrombectomy Devices, by Country/Region, 2021–2030 (USD Million)
Table 5 Global Venous Thromboembolism Treatment Market for Inferior Vena Cava Filters, by Type, 2021–2030 (USD Million)
Table 6 Global Venous Thromboembolism Treatment Market for Inferior Vena Cava Filters, by Country/Region, 2021–2030 (USD Million)
Table 7 Global Retrievable Filters Market, by Country/Region, 2021–2030 (USD Million)
Table 8 Global Permanent Filters Market, by Country/Region, 2021–2030 (USD Million)
Table 9 Global Venous Thromboembolism Treatment Market for Stockings, by Country/Region, 2021–2030 (USD Million)
Table 10 Global Venous Thromboembolism Treatment Market for Compression Pumps, by Country/Region, 2021–2030 (USD Million)
Table 11 Global Venous Thromboembolism Treatment Market for Other Devices & Accessories, by Country/Region, 2021–2030 (USD Million)
Table 12 Global Venous Thromboembolism Treatment Market, by Application, 2021–2030 (USD Million)
Table 13 Global Venous Thromboembolism Treatment Market for Deep Vein Thrombosis (DVT), by Country/Region, 2021–2030 (USD Million)
Table 14 Global Venous Thromboembolism Treatment Market for Pulmonary Embolism (PE), by Country/Region, 2021–2030 (USD Million)
Table 15 Venous Thromboembolism Treatment Market, by End User, 2021–2030 (USD Million)
Table 16 Global Venous Thromboembolism Treatment Market for Hospitals, by Country/Region, 2021–2030 (USD Million)
Table 17 Global Venous Thromboembolism Market for Ambulatory Care Centers, by Country/Region, 2021–2030 (USD Million)
Table 18 Global Venous Thromboembolism Market for Other End Users, by Country/Region, 2021–2030 (USD Million)
Table 19 Global Venous Thromboembolism Treatment Market, by Country/Region, 2021–2030 (USD Million)
Table 20 North America: Venous Thromboembolism Treatment Market, by Country, 2021–2030 (USD Million)
Table 21 North America: Venous Thromboembolism Treatment Market, by Device, 2021–2030 (USD Million)
Table 22 North America: Inferior Vena Cava Filters Market, by Type, 2021–2030 (USD Million)
Table 23 North America: Venous Thromboembolism Treatment Market, by Application, 2021–2030 (USD Million)
Table 24 North America: Venous Thromboembolism Treatment Market, by End User, 2021–2030 (USD Million)
Table 25 U.S.: Venous Thromboembolism Treatment Market, by Device, 2021–2030 (USD Million)
Table 26 U.S.: Inferior Vena Cava Filters Market, by Type, 2021–2030 (USD Million)
Table 27 U.S.: Venous Thromboembolism Treatment Market, by Application, 2021–2030 (USD Million)
Table 28 U.S.: Venous Thromboembolism Treatment Market, by End User, 2021–2030 (USD Million)
Table 29 Canada: Prevalence of Diseases/Conditions in The Geriatric (Age 65 Years And Above) Population (2019–2020)
Table 30 Canada: Venous Thromboembolism Treatment Market, by Device, 2021–2030 (USD Million)
Table 31 Canada: Inferior Vena Cava Filters Market, by Type, 2021–2030 (USD Million)
Table 32 Canada: Venous Thromboembolism Treatment Market, by Application, 2021–2030 (USD Million)
Table 33 Canada: Venous Thromboembolism Treatment Market, by End User, 2021–2030 (USD Million)
Table 34 Europe: Venous Thromboembolism Treatment Market, by Country/Region, 2021–2030 (USD Million)
Table 35 Europe: Venous Thromboembolism Treatment Market, by Device, 2021–2030 (USD Million)
Table 36 Europe: Inferior Vena Cava Filters Market, by Type, 2021–2030 (USD Million)
Table 37 Europe: Venous Thromboembolism Treatment Market, by Application, 2021–2030 (USD Million)
Table 38 Europe: Venous Thromboembolism Treatment Market, by End User, 2021–2030 (USD Million)
Table 39 Germany: Venous Thromboembolism Treatment Market, by Device, 2021–2030 (USD Million)
Table 40 Germany: Inferior Vena Cava Filters Market, by Type, 2021–2030 (USD Million)
Table 41 Germany: Venous Thromboembolism Treatment Market, by Application, 2021–2030 (USD Million)
Table 42 Germany: Venous Thromboembolism Treatment Market, by End User, 2021–2030 (USD Million)
Table 43 France: Venous Thromboembolism Treatment Market, by Device, 2021–2030 (USD Million)
Table 44 France: Inferior Vena Cava Filters Market, by Type, 2021–2030 (USD Million)
Table 45 France: Venous Thromboembolism Treatment Market, by Application, 2021–2030 (USD Million)
Table 46 France: Venous Thromboembolism Treatment Market, by End User, 2021–2030 (USD Million)
Table 47 U.K.: Venous Thromboembolism Treatment Market, by Device, 2021–2030 (USD Million)
Table 48 U.K.: Inferior Vena Cava Filters Market, by Type, 2021–2030 (USD Million)
Table 49 U.K.: Venous Thromboembolism Treatment Market, by Application, 2021–2030 (USD Million)
Table 50 U.K.: Venous Thromboembolism Treatment Market, by End User, 2021–2030 (USD Million)
Table 51 Italy: Venous Thromboembolism Treatment Market, by Device, 2021–2030 (USD Million)
Table 52 Italy: Inferior Vena Cava Filters Market, by Type, 2021–2030 (USD Million)
Table 53 Italy: Venous Thromboembolism Treatment Market, by Application, 2021–2030 (USD Million)
Table 54 Italy: Venous Thromboembolism Treatment Market, by End User, 2021–2030 (USD Million)
Table 55 Spain: Venous Thromboembolism Treatment Market, by Device, 2021–2030 (USD Million)
Table 56 Spain: Inferior Vena Cava Filters Market, by Type, 2021–2030 (USD Million)
Table 57 Spain: Venous Thromboembolism Treatment Market, by Application, 2021–2030 (USD Million)
Table 58 Spain: Venous Thromboembolism Treatment Market, by End User, 2021–2030 (USD Million)
Table 59 Number of People Aged 56 And Above, by Country, 2012- 2022
Table 60 Estimated Number of New Cancer Cases, by Country, 2020 Vs. 2030
Table 61 RoE: Venous Thromboembolism Treatment Market, by Device, 2021–2030 (USD Million)
Table 62 RoE: Inferior Vena Cava Filters Market, by Type, 2021–2030 (USD Million)
Table 63 RoE: Venous Thromboembolism Treatment Market, by Application, 2021–2030 (USD Million)
Table 64 RoE: Venous Thromboembolism Treatment Market, by End User, 2021–2030 (USD Million)
Table 65 Asia-Pacific: Venous Thromboembolism Treatment Market, by Country/Region, 2021–2030 (USD Million)
Table 66 Asia-Pacific: Venous Thromboembolism Treatment Market, by Device, 2021–2030 (USD Million)
Table 67 Asia-Pacific: Inferior Vena Cava Filters Market, by Type, 2021–2030 (USD Million)
Table 68 Asia-Pacific: Venous Thromboembolism Treatment Market, by Application, 2021–2030 (USD Million)
Table 69 Asia-Pacific: Venous Thromboembolism Treatment Market, by End User, 2021–2030 (USD Million)
Table 70 China: Venous Thromboembolism Treatment Market, by Device, 2021–2030 (USD Million)
Table 71 China: Inferior Vena Cava Filters Market, by Type, 2021–2030 (USD Million)
Table 72 China: Venous Thromboembolism Treatment Market, by Application, 2021–2030 (USD Million)
Table 73 China: Venous Thromboembolism Treatment Market, by End User, 2021–2030 (USD Million)
Table 74 Japan: Venous Thromboembolism Treatment Market, by Device, 2021–2030 (USD Million)
Table 75 Japan: Inferior Vena Cava Filters Market, by Type, 2021–2030 (USD Million)
Table 76 Japan: Venous Thromboembolism Treatment Market, by Application, 2021–2030 (USD Million)
Table 77 Japan: Venous Thromboembolism Treatment Market, by End User, 2021–2030 (USD Million)
Table 78 India: Venous Thromboembolism Treatment Market, by Device, 2021–2030 (USD Million)
Table 79 India: Inferior Vena Cava Filters Market, by Type, 2021–2030 (USD Million)
Table 80 India: Venous Thromboembolism Treatment Market, by Application, 2021–2030 (USD Million)
Table 81 India: Venous Thromboembolism Treatment Market, by End User, 2021–2030 (USD Million)
Table 82 RoAPAC: Venous Thromboembolism Treatment Market, by Device, 2021–2030 (USD Million)
Table 83 RoAPAC: Inferior Vena Cava Filters Market, by Type, 2021–2030 (USD Million)
Table 84 RoAPAC: Venous Thromboembolism Treatment Market, by Application, 2021–2030 (USD Million)
Table 85 RoAPAC: Venous Thromboembolism Treatment Market, by End User, 2021–2030 (USD Million)
Table 86 Latin America: Venous Thromboembolism Treatment Market, by Device, 2021–2030 (USD Million)
Table 87 Latin America: Inferior Vena Cava Filters Market, by Type, 2021–2030 (USD Million)
Table 88 Latin America: Venous Thromboembolism Treatment Market, by Application, 2021–2030 (USD Million)
Table 89 Latin America: Venous Thromboembolism Treatment Market, by End User, 2021–2030 (USD Million)
Table 90 Middle East & Africa: Venous Thromboembolism Treatment Market, by Device, 2021–2030 (USD Million)
Table 91 Middle East & Africa: Inferior Vena Cava Filters Market, by Type, 2021–2030 (USD Million)
Table 92 Middle East & Africa: Venous Thromboembolism Treatment Market, by Application, 2021–2030 (USD Million)
Table 93 Middle East & Africa: Venous Thromboembolism Treatment Market, by End User, 2021–2030 (USD Million)
Table 94 Recent Developments, by Company (2020–2023)
List of Figures
Figure 1 Research Process
Figure 2 Secondary Sources Referenced for this Study
Figure 3 Primary Research Techniques
Figure 4 Key Executives Interviewed
Figure 5 Breakdown of Primary Interviews (Supply-Side & Demand-Side)
Figure 6 Market Sizing and Growth Forecast Approach
Figure 7 Global Venous Thromboembolism Treatment Market, by Device, 2023 Vs. 2030 (USD Million)
Figure 8 Global Venous Thromboembolism Treatment Market, by Application, 2023 Vs. 2030 (USD Million)
Figure 9 Global Venous Thromboembolism Treatment Market, by End User, 2023 Vs. 2030 (USD Million)
Figure 10 Global Venous Thromboembolism Treatment Market, by Geography
Figure 11 Impact Analysis of Market Dynamics
Figure 12 Global Venous Thromboembolism Treatment Market, by Device, 2023 Vs. 2030 (USD Million)
Figure 13 Global Venous Thromboembolism Treatment Market, by Application, 2023 Vs. 2030 (USD Million)
Figure 14 Venous Thromboembolism Treatment Market, by End User, 2023 Vs. 2030 (USD Million)
Figure 15 Global Venous Thromboembolism Treatment Market, by Geography, 2023 Vs. 2030 (USD Million)
Figure 16 North America: Venous Thromboembolism Treatment Market Snapshot
Figure 17 Canada: Estimated Number of New Cancer Cases, 2020-2035
Figure 18 Europe: Venous Thromboembolism Treatment Market Snapshot
Figure 19 France: Percentage of Population Aged 65 Years and Above (2016–2022)
Figure 20 France: Prevalence of Chronic Diseases in People Aged 65 And Above (2020)
Figure 21 U.K.: Number of Diabetes And Urogenital, Blood, and Endocrine Disease Cases – DALYs (Disability-Adjusted Life Years), 2017–2020 (In Thousands)
Figure 22 Spain: Estimated Number of New Cancer Cases (2020-2035)
Figure 23 Switzerland: Number of New Cancer Cases Reported (2020–2040)
Figure 24 Asia-Pacific: Venous Thromboembolism Treatment Market Snapshot
Figure 25 Japan: Percentage Share of the Geriatric Population (Aged 65 Years And Above) (2015–2022)
Figure 26 Saudi Arabia: Number of People Aged 65 Years and Above, 2017–2021 (In Thousands)
Figure 27 South Africa: Number of People with Diabetes, 2000–2045 (In Thousands)
Figure 28 Key Growth Strategies Adopted by Leading Players 2020-2023
Figure 29 Venous Thromboembolism Treatment Market: Competitive Benchmarking, by Device
Figure 30 Venous Thromboembolism Treatment Market: Competitive Benchmarking, by Region
Figure 31 Competitive Dashboard: Venous Thromboembolism Treatment Market
Figure 32 Global Venous Thromboembolism Treatment Market Share Analysis, by Key Players (2022)
Figure 33 AngioDynamics, Inc.: Financial Overview (2023)
Figure 34 ArjoHuntleigh Ab: Financial Overview (2022)
Figure 35 Boston Scientific Corporation: Financial Overview (2022)
Figure 36 Cardinal, Inc.: Financial Overview (2022)
Figure 37 Koninklijke Philips N.V.: Financial Overview (2022)
Figure 38 Enovis Corporation: Financial Overview (2022)
Figure 39 LifeTech Scientific Corporation: Financial Overview (2022)
Figure 40 Medtronic plc: Financial Overview (2023)
Figure 41 Stryker Corporation: Financial Overview (2022)
Published Date: Jun-2024
Published Date: Jul-2024
Please enter your corporate email id here to view sample report.
Subscribe to get the latest industry updates