Resources
About Us
Genomics Market by Technology (Sequencing, Microarray, PCR, Nucleic Acid Extraction), Application (Drug Discovery, Diagnostic, Research), End User (Pharmaceutical, Hospital, Academic), Offering (Instrument, Consumables, Software) - Global Forecast to 2031
Report ID: MRHC - 104157 Pages: 320 Feb-2024 Formats*: PDF Category: Healthcare Delivery: 2 to 4 Hours Download Free Sample ReportGenomics studies the structure, function, evolution, and mapping of genomes. It includes several operations, ranging from sequencing to analysis, to understand the genetic basis of various biological phenomena. Genomics can be applied in various fields, including medicine, agriculture, biotechnology, and ecology, and is critical for understanding the complexity of living organisms. By understanding the genetic makeup of an organism, researchers can develop targeted therapies, design new crops and livestock, and gain insights into evolutionary history and ecological interactions.
The growth of the genomics market is driven by the rising prevalence of genetic diseases, the increasing incorporation of genomic data in clinical workflows, increasing funding and investments in genomics projects, the growing applications of genomics in the healthcare sector, rising pharmaceutical R&D expenditures, decreasing costs of sequencing, and increasing healthcare spending. However, the lack of standardized approaches in genomics and concerns over the security & privacy of genomic data restrain the growth of this market.
Moreover, the rising adoption of personalized medicines and gene therapies is expected to generate market growth opportunities. However, the shortage of skilled bioinformatics and genomics personnel and the commercialization and scaling of genomic technologies are major challenges for market stakeholders.
There has been a significant increase in funding for genomics research due to various research activities, which has led to the development of advanced sequencing technologies and bioinformatics tools that have made it possible to rapidly analyze vast amounts of genomic data. Pharmaceutical companies are investing in genomics research to discover new drugs, develop personalized medicines, and improve their understanding of disease mechanisms. The pharmaceutical industry is also investing in genomic data-sharing initiatives to accelerate research and development. In December 2022, the U.K. government announced $217 million (£175 million) in funding for genomics research, including $130 million (£105 million) to boost the diagnosis of rare genetic diseases in newborns.
The availability of genomic data has also created opportunities for developing targeted therapies and precision medicine and enabled researchers to understand the genetic basis of diseases, develop new diagnostics, and find potential targets for drug development. Increasing investments in genomics research are expected to lead to significant medical advancements, including new drugs, targeted therapies, and personalized medicine.
The rising adoption of personalized medicines and gene therapies indicates advancements in genomics and molecular biology aimed at tailoring treatments to the needs of individual patients and addressing diseases at the genetic level. Personalized medicine has made significant progress in cancer treatment. The genetic profiling of tumors helps identify targetable mutations, enabling the development of targeted therapies that attack cancer cells with precision, minimizing harm to healthy cells. For rare genetic disorders, personalized medicine approaches involve identifying specific genetic mutations causing a condition and designing therapies to correct or mitigate their effects.
Gene therapy can correct or replace defective genes responsible for causing diseases. Gene therapy has been successful in treating certain genetic disorders of the blood and immune system, such as Severe Combined Immunodeficiency (SCID), by modifying a patient’s own hematopoietic stem cells outside the body and then reintroducing them into the body. Moreover, gene therapies for neurodegenerative diseases like Parkinson’s and Alzheimer’s are being researched, with an aim to deliver therapeutic genes to affected brain cells. These factors are boosting the adoption of genomics products, thereby driving market growth.
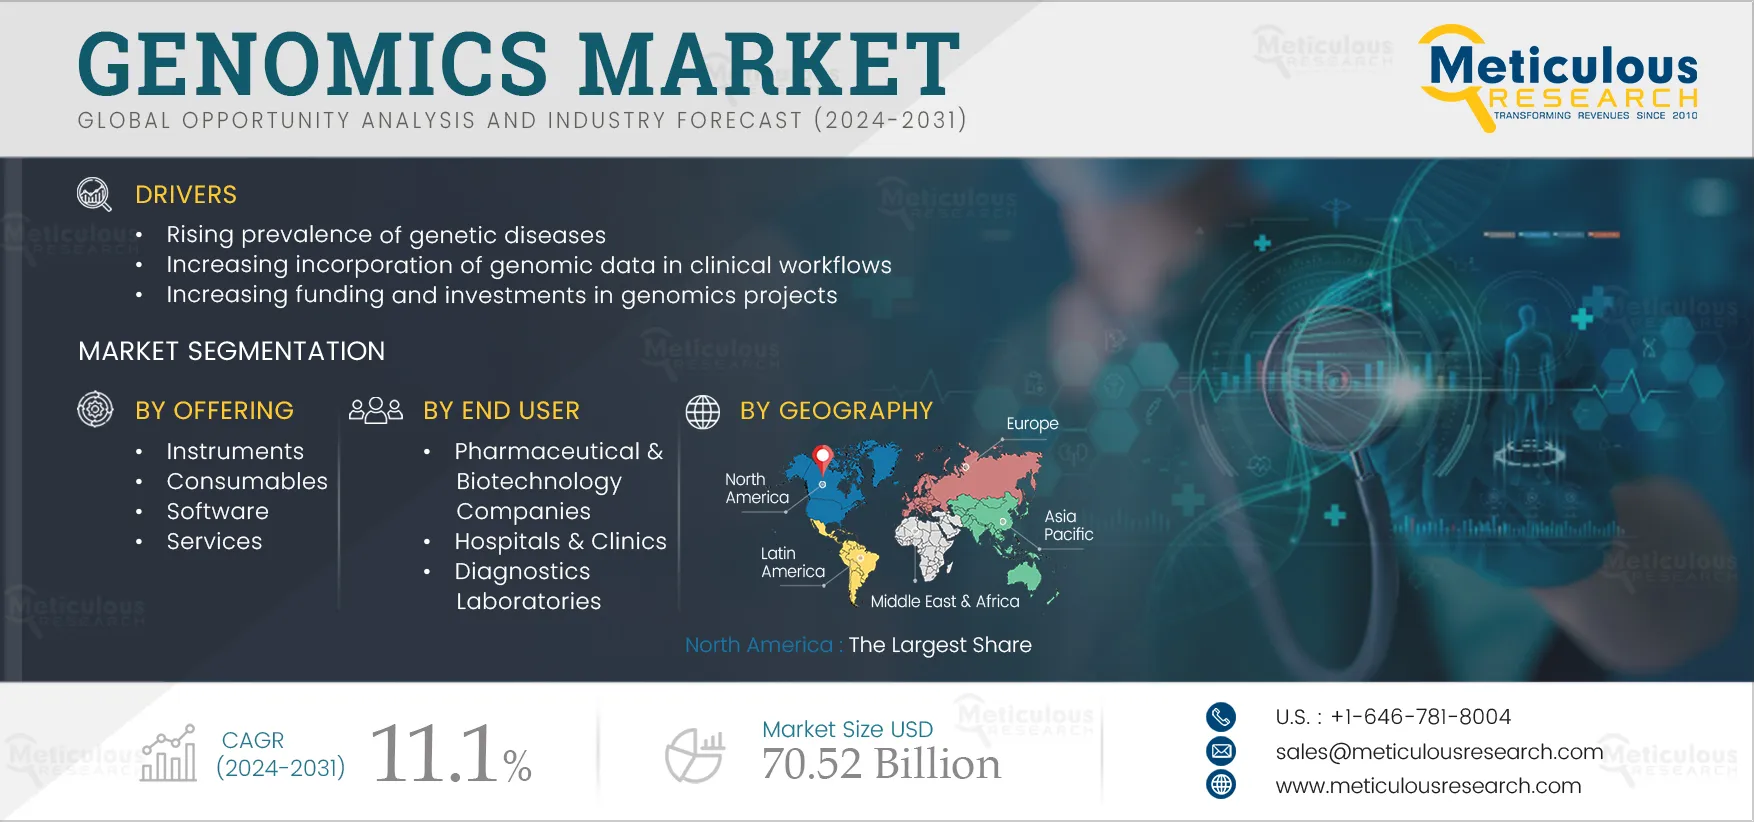
Based on offering, the genomics market is segmented into systems, consumables, software, and services. In 2024, the consumables segment is expected to account for the largest share of the genomics market. The segment’s large market share can be attributed to the high adoption of genetic testing and increased usage of consumables for the same. Genomic testing during pregnancy can help identify genetic disorders in the developing fetus, which is increasing the adoption of consumables for genetic testing. The demand for high-throughput sequencing and automation has risen in recent years, leading to an increase in sample preparation rates and quality control procedures. Furthermore, it has boosted the utilization of consumables such as kits and reagents. The recurring purchase of consumables also contributes to the substantial market share of this segment.
Based on technology, the genomics market is segmented into sequencing, microarray, PCR, nucleic acid extraction and purification, and other technologies. The sequencing segment is expected to record the highest CAGR during the forecast period. The factors contributing to the segment’s highest CAGR are technological advancements in sequencing, improvements in the efficiency of sequencing processes, and the increased scalability of sequencing technologies. With the development of new sequencing technologies, the cost of sequencing has significantly decreased, and the speed and accuracy of sequencing have improved. These factors have made sequencing more accessible and cost-effective, allowing researchers to sequence more genomes.
Click here to: Get Free Sample Pages of this Report
Based on application, the genomics market is segmented into drug discovery & development, diagnostics, life science research, and other applications. The drug discovery & development segment is expected to record the highest CAGR during the forecast period. The segment’s growth is mainly driven by the high prevalence of chronic diseases such as diabetes and cancer and the need to discover effective drugs and therapies against these diseases. The use of genomic technologies is rising in the field of precision medicine, especially for the discovery of novel therapeutics. As precision medicine continues to gain momentum, pharmaceutical companies are increasingly investing in genomics to advance their drug discovery and development efforts.
Based on end user, the genomics market is segmented into pharmaceutical & biotechnology companies, hospitals, academic & research institutes, diagnostic laboratories, contract research organizations, and other end users. In 2024, the pharmaceutical & biotechnology companies segment is expected to account for the largest share of the genomics market. The large market share of this segment can be attributed to the increasing use of genomics by pharmaceutical & biotechnology companies for the identification and validation of potential drug targets for biomarker discovery, pharmacogenomics, and genomic screening techniques. In drug discovery, genomics has been instrumental in identifying potential targets, reducing errors in clinical trials, and accelerating the time taken to bring new drugs to the market. Moreover, the use of genomics in personalized medicine is also increasing, as it allows for a more targeted approach to drug development by identifying specific genetic targets for new therapies. This approach can lead to the development of more effective drugs with fewer side effects. The increased need to commercialize novel therapies faster also supports the segment’s large share.
Based on geography, the genomics market is segmented into North America, Europe, Asia-Pacific, Latin America, and the Middle East & Africa. In 2024, North America is expected to account for the largest share of the genomics market. North America’s large market share can be attributed to the high burden of genetic diseases, growing awareness about early genetic disease diagnostics, government support for genetic testing for hereditary cancers and newborn screening, and the presence of major market players in the region. Rising investments in genomics research to support the development of therapeutics for cancer and other therapy areas also contribute to the growth of this regional market. According to data published by the Government of Canada in November 2022, the Canadian government supports the Genomics Research and Development Initiative (GRDI) with nearly USD 20 million annually to conduct vital genomics research.
The report offers a competitive landscape based on an extensive assessment of the product portfolios, geographic presence, and key strategic developments of leading market players in the last three to four years. The key players operating in the genomics market are Agilent Technologies, Inc. (U.S.), Bio-Rad Laboratories, Inc. (U.S.), Danaher Corporation (U.S.), Thermo Fisher Scientific Inc. (U.S.), Illumina, Inc. (U.S.), QIAGEN N.V. (Netherlands), Pacific Biosciences of California, Inc. (U.S.), Oxford Nanopore Technologies Plc. (U.K.), Eppendorf SE (Germany), Myriad Genetics, Inc. (U.S.), Revvity, Inc. (Formerly PerkinElmer, Inc.) (U.S.), and BGI Genomics Co. Ltd (China).
Particulars |
Details |
Number of Pages |
320 |
Format |
|
Forecast Period |
2024-2031 |
Base Year |
2023 |
CAGR (2024–2031) |
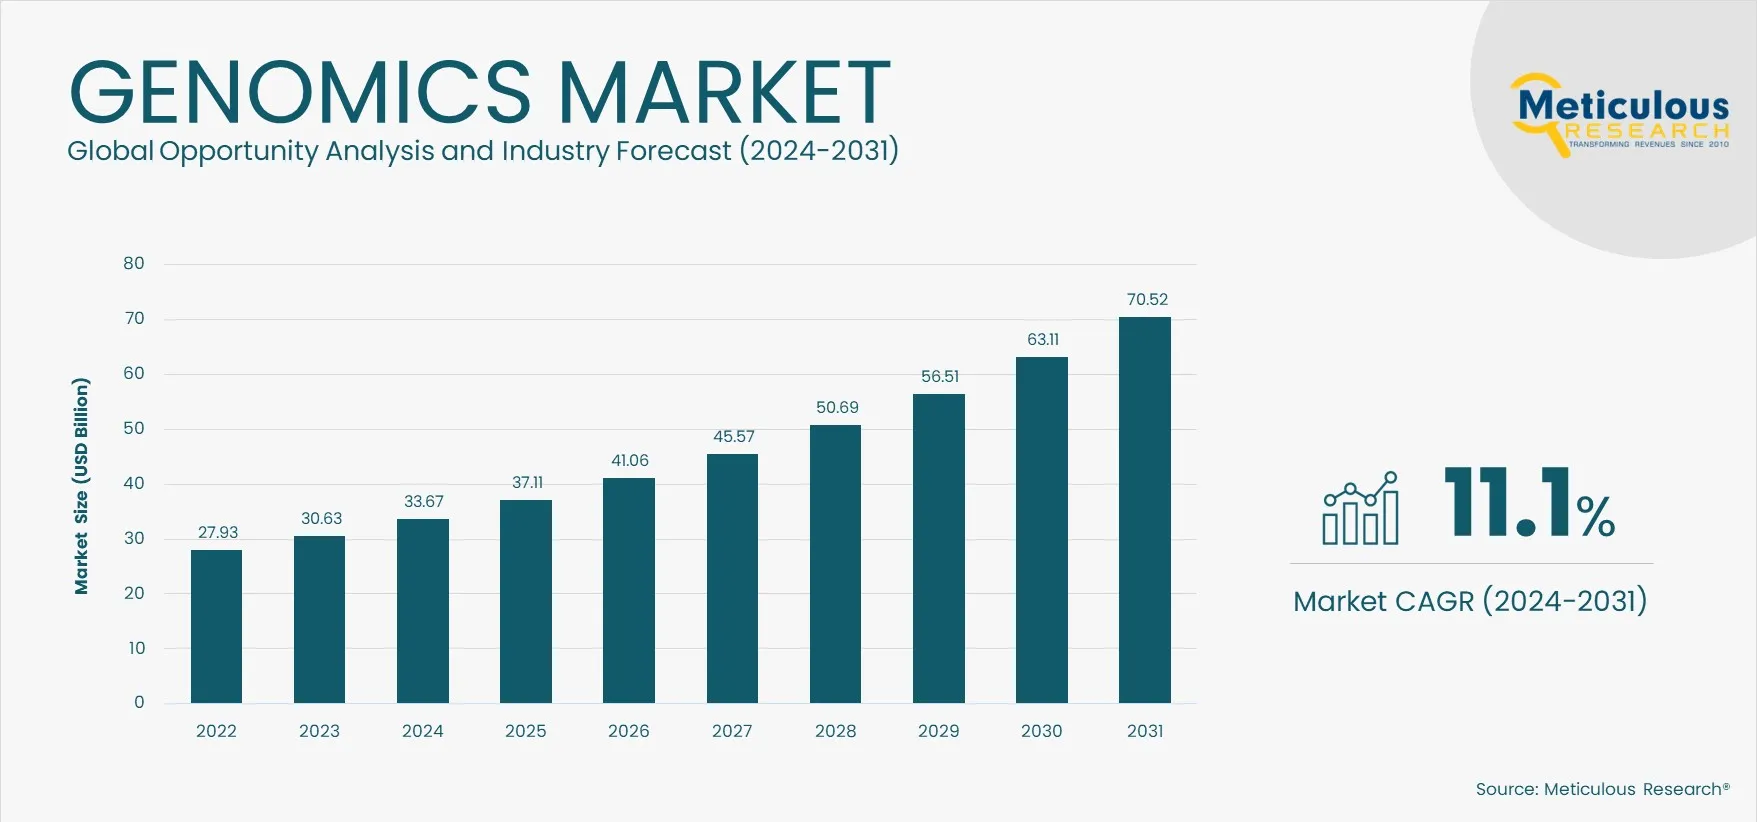
11.1% |
Estimated Market Size (Value) |
$70.52 Billion by 2031 |
Segments Covered |
By Offering
By Technology
By Application
By End User
|
Countries Covered |
North America (U.S. and Canada), Europe (Germany, France, U.K., Italy, Spain, Rest of Europe), Asia-Pacific (China, Japan, India, Rest of Asia-Pacific), Latin America (Brazil, Mexico, Rest of Latin America), and the Middle East & Africa |
Key Companies Profiled |
Agilent Technologies, Inc. (U.S.), Bio-Rad Laboratories, Inc. (U.S.), Danaher Corporation (U.S.), Thermo Fisher Scientific Inc. (U.S.), Illumina, Inc. (U.S.), QIAGEN N.V. (Netherlands), Pacific Biosciences of California, Inc. (U.S.), Oxford Nanopore Technologies Plc. (U.K.), Eppendorf SE (Germany), Myriad Genetics, Inc. (U.S.), Revvity, Inc. (Formerly PerkinElmer, Inc.) (U.S.), and BGI Genomics Co. Ltd (China) |
This study offers a detailed assessment of the genomics market, including the market sizes & forecasts for offering, technology, application, end user, and geography segments. This report also provides the value analysis of various segments and subsegments of the genomics market at the regional and country levels.
The genomics market is projected to reach $70.52 billion by 2031, at a CAGR of 11.1% during the forecast period.
Based on offering, in 2024, the consumables segment is expected to account for the largest share of the market due to the high demand for consumables due to the increasing number of genetic testing and quality control processes.
Based on end user, in 2024, the pharmaceutical & biotechnology companies segment is expected to account for the largest market share due to increased R&D spending among pharmaceutical companies.
The growth of the genomics market is driven by the rising prevalence of genetic diseases, the increasing incorporation of genomic data in clinical workflows, increasing funding and investments in genomics projects, the growing applications of genomics in the healthcare sector, rising pharmaceutical R&D expenditures, decreasing costs of sequencing, and increasing healthcare spending.
Moreover, the rising adoption of personalized medicines and gene therapies is expected to generate market growth opportunities.
The key players profiled in the genomics market report are Agilent Technologies, Inc. (U.S.), Bio-Rad Laboratories, Inc. (U.S.), Danaher Corporation (U.S.), Thermo Fisher Scientific Inc. (U.S.), Illumina, Inc. (U.S.), QIAGEN N.V. (Netherlands), Pacific Biosciences of California, Inc. (U.S.), Oxford Nanopore Technologies Plc. (U.K.), Eppendorf SE (Germany), Myriad Genetics, Inc. (U.S.), Revvity, Inc. (Formerly PerkinElmer, Inc.) (U.S.), and BGI Genomics Co. Ltd (China).
Emerging economies in the Asia-Pacific region are expected to offer significant growth opportunities for market players due to increasing cases of inherited diseases such as Down syndrome, colon (colorectal) cancer, and breast cancer, growing awareness about the significance of genetic tests, increasing healthcare expenditures, government initiatives promoting genetic testing, and increasing investments by major market players.
1. Introduction
1.1. Market Definition & Scope
1.2. Market Ecosystem
1.3. Currency & Limitations
1.4. Key Stakeholders
2. Research Methodology
2.1. Research Approach
2.2. Process of Data Collection and Validation
2.2.1. Secondary Research
2.2.2. Primary Research/Interviews with Key Opinion Leaders of the Industry
2.3. Market Sizing and Forecast
2.3.1. Market Size Estimation Approach
2.3.2. Growth Forecast Approach
2.3.3. Market Share Analysis
2.4. Assumptions for the Study
3. Executive Summary
4. Market Insights
4.1. Overview
4.2. Factors Affecting Market Growth
4.2.1. Impact Analysis of Market Dynamics
4.2.1.1. Rising Prevalence of Genetic Diseases and the Incorporation of Genomic Data in Clinical Workflows Driving Market Growth
4.2.1.2. Concerns Over the Security & Privacy of Genomic Data Limiting the Adoption of Genomics Products
4.2.1.3. Rising Adoption of Personalized Medicines and Gene Therapies
4.2.1.4. Commercializing and Scaling Genomic Technologies Remain Major Challenges for Market Stakeholders
4.2.2. Factor Analysis
4.3. Technology Trends
4.4. Genomics Market: Regulatory Analysis
4.4.1. North America
4.4.1.1. U.S.
4.4.1.2. Canada
4.4.2. Europe
4.4.2.1. Shift From Pre-Approval to A Lifecycle Approach
4.4.2.2. Classification Changes
4.4.2.3. Stronger Supervision
4.4.2.4. Clearer Rights and Responsibilities for Economic Operators
4.4.2.5. Traceability/EUDAMED
4.4.2.6. General Safety and Performance Requirements
4.4.2.7. Performance Evaluation and Clinical Evidence
4.4.3. Asia-Pacific
4.4.3.1. China
4.4.3.2. Japan
4.4.3.3. India
4.4.4. Latin America
4.4.5. Middle East & Africa
4.4.6. Guidelines and Regulations for Gene Therapy and Genome Editing
4.5. Pricing Analysis
4.6. Porter's Five Forces Analysis
4.6.1. Bargaining Power of Buyers
4.6.2. Bargaining Power of Suppliers
4.6.3. Threat of Substitutes
4.6.4. Threat of New Entrants
4.6.5. Degree of Competition
5. Genomics Market Assessment—by Offering
5.1. Overview
5.2. Consumables
5.3. Instruments
5.4. Software
5.5. Services
6. Genomics Market Assessment—by Technology
6.1. Overview
6.2. Polymerase Chain Reaction (PCR)
6.3. Sequencing
6.3.1. Next-Generation Sequencing (NGS)
6.3.2. Other Sequencing Technologies
6.4. Nucleic Acid Extraction & Purification
6.5. Microarray
6.6. Other Technologies
7. Genomics Market Assessment—by Application
7.1. Overview
7.2. Diagnostics
7.3. Drug Discovery & Development
7.4. Life Sciences Research
7.4.1. Cancer Research
7.4.2. Stem Cell Research
7.4.3. Other Life Sciences Research
7.5. Other Applications
8. Genomics Market Assessment—by End User
8.1. Overview
8.2. Pharmaceutical & Biotechnology Companies
8.3. Hospitals & Clinics
8.4. Diagnostic Laboratories
8.5. Contract Research Organizations (CROs)
8.6. Academic & Research Institutes
8.7. Other End Users
9. Genomics Market Assessment—by Geography
9.1. Overview
9.2. North America
9.2.1. U.S.
9.2.2. Canada
9.3. Europe
9.3.1. Germany
9.3.2. France
9.3.3. U.K.
9.3.4. Italy
9.3.5. Spain
9.3.6. Rest Of Europe
9.4. Asia-Pacific
9.4.1. China
9.4.2. Japan
9.4.3. India
9.4.4. Rest Of Asia-Pacific
9.5. Latin America
9.5.1. Brazil
9.5.2. Mexico
9.5.3. Rest of Latin America
9.6. Middle East & Africa
10. Competition Analysis
10.1. Introduction
10.2. Key Growth Strategies
10.3. Competitive Benchmarking
10.4. Competitive Dashboard
10.4.1. Industry Leaders
10.4.2. Market Differentiators
10.4.3. Vanguards
10.4.4. Emerging Companies
10.5. Market Share Analysis
10.5.1. Thermo Fisher Scientific Inc. (U.S.)
10.5.2. Illumina, Inc. (U.S.)
10.5.3. Qiagen N.V. (Netherlands)
11. Company Profiles (Company Overview, Financial Snapshot, Product Portfolio, and Strategic Developments)
11.1. Thermo Fisher Scientific Inc.
11.2. Illumina, Inc
11.3. Qiagen N.V.
11.4. Danaher Corporation
11.5. Agilent Technologies, Inc.
11.6. Bio-Rad Laboratories, Inc.
11.7. Pacific Biosciences of California, Inc.
11.8. Oxford Nanopore Technologies plc
11.9. Eppendorf SE
11.10. Myriad Genetics, Inc.
11.11. Reevity, Inc. (Formerly PerkinElmer, Inc.)
11.12. BGI Genomics Co.,Ltd.
(Note: SWOT Analysis of Top 5 Companies is Provided)
12. Appendix
12.1. Available Customization
12.2. Related Reports
List of Tables
Table 1 Regulatory Authorities Governing Genomic Products, by Country/Region
Table 2 Guidelines for Gene Therapy and Genome Editing, by Regulatory Body
Table 3 Pricing: Genomics Instruments
Table 4 Pricing: Genomics Consumables
Table 5 Average Selling Prices: Genomics Instruments
Table 6 Average Selling Prices: Genomics Consumables
Table 7 Global Genomics Market, by Offering, 2022–2031 (USD Million)
Table 8 Global Genomics Consumables Market, by Country/Region, 2022–2031 (USD Million)
Table 9 Global Genomics Instruments Market, by Country/Region, 2022–2031 (USD Million)
Table 10 Global Genomics Software Market, by Country/Region, 2022–2031 (USD Million)
Table 11 Global Genomics Services Market, by Country/Region, 2022–2031 (USD Million)
Table 12 Global Genomics Market, by Technology, 2022–2031 (USD Million)
Table 13 Global Genomics Market for Polymerase Chain Reaction, by Country/Region, 2022–2031 (USD Million)
Table 14 Global Genomics Market for Sequencing, by Type, 2022–2031 (USD Million)
Table 15 Global Genomics Market for Sequencing, by Country/Region, 2022–2031 (USD Million)
Table 16 Global Genomics Market for Next-Generation Sequencing, by Country/Region, 2022–2031 (USD Million)
Table 17 Global Genomics Market for Other Sequencing Technologies, by Country/Region, 2022–2031 (USD Million)
Table 18 Global Genomics Market for Nucleic Acid Extraction and Purification, by Country/Region, 2022–2031 (USD Million)
Table 19 Global Genomics Market for Microarrays, by Country/Region, 2022–2031 (USD Million)
Table 20 Global Genomics Market for Other Technologies, by Country/Region, 2022–2031 (USD Million)
Table 21 Global Genomics Market, by Application, 2022–2031 (USD Million)
Table 22 Global Genomics Market for Diagnostics, by Country/Region, 2022–2031 (USD Million)
Table 23 Global Genomics Market for Drug Discovery and Development, by Country/Region, 2022–2031 (USD Million)
Table 24 Global Genomics Market for Life Sciences Research, by Type, 2022–2031 (USD Million)
Table 25 Global Genomics Market for Life Sciences Research, by Country/Region, 2022–2031 (USD Million)
Table 26 Number of New Cancer Cases, by Region, 2020 Vs. 2040 (In Million)
Table 27 Global Genomics Market for Cancer Research, by Country/Region, 2022–2031 (USD Million)
Table 28 Global Genomics Market for Stem Cell Research, by Country/Region, 2022–2031 (USD Million)
Table 29 Global Genomics Market for Other Life Sciences Research, by Country/Region, 2022–2031 (USD Million)
Table 30 Global Genomics Market for Other Applications, by Country/Region, 2022–2031 (USD Million)
Table 31 Global Genomics Market, by End User, 2022–2031 (USD Million)
Table 32 Global Genomics Market for Pharmaceutical & Biotechnology Companies, by Country/Region, 2022–2031 (USD Million)
Table 33 Global Genomics Market for Hospitals & Clinics, by Country/Region, 2022–2031 (USD Million)
Table 34 Global Genomics Market for Diagnostic Laboratories, by Country/Region, 2022–2031 (USD Million)
Table 35 Global Genomics Market for Contract Research Organizations (CROs) by Country/Region, 2022–2031 (USD Million)
Table 36 Global Genomics Market for Academic & Research Institutes, by Country/Region, 2022–2031 (USD Million)
Table 37 Global Genomics Market for Other End Users, by Country/Region, 2022–2031 (USD Million)
Table 38 Global Genomics Market, by Country/Region, 2022–2031 (USD Million)
Table 39 North America: Genomics Market, by Country, 2022–2031 (USD Million)
Table 40 North America: Genomics Market, by Offering, 2022–2031 (USD Million)
Table 41 North America: Genomics Market, by Technology, 2022–2031 (USD Million)
Table 42 North America: Sequencing Market, by Type, 2022–2031 (USD Million)
Table 43 North America: Genomics Market, by Application, 2022–2031 (USD Million)
Table 44 North America: Genomics Market for Life Science Research, by Type, 2022–2031 (USD Million)
Table 45 North America: Genomics Market, by End User, 2022–2031 (USD Million)
Table 46 U.S.: Genomics Market, by Offering, 2022–2031 (USD Million)
Table 47 U.S.: Genomics Market, by Technology, 2022–2031 (USD Million)
Table 48 U.S.: Sequencing Market, by Type, 2022–2031 (USD Million)
Table 49 U.S.: Genomics Market, by Application, 2022–2031 (USD Million)
Table 50 U.S.: Genomics Market for Life Science Research, by Type, 2022–2031 (USD Million)
Table 51 U.S.: Genomics Market, by End User, 2022–2031 (USD Million)
Table 52 Canada: Genomics Market, by Offering, 2022–2031 (USD Million)
Table 53 Canada: Genomics Market, by Technology, 2022–2031 (USD Million)
Table 54 Canada: Sequencing Market, by Type, 2022–2031 (USD Million)
Table 55 Canada: Genomics Market, by Application, 2022–2031 (USD Million)
Table 56 Canada: Genomics Market for Life Science Research, by Type, 2022–2031 (USD Million)
Table 57 Canada: Genomics Market, by End User, 2022–2031 (USD Million)
Table 58 Europe: Genomics Market, by Country/Region, 2022–2031 (USD Million)
Table 59 Europe: Genomics Market, by Offering, 2022–2031 (USD Million)
Table 60 Europe: Genomics Market, by Technology, 2022–2031 (USD Million)
Table 61 Europe: Sequencing Market, by Type, 2022–2031 (USD Million)
Table 62 Europe: Genomics Market, by Application, 2022–2031 (USD Million)
Table 63 Europe: Genomics Market for Life Science Research, by Type, 2022–2031 (USD Million)
Table 64 Europe: Genomics Market, by End User, 2022–2031 (USD Million)
Table 65 Germany: Genomics Market, by Offering, 2022–2031 (USD Million)
Table 66 Germany: Genomics Market, by Technology, 2022–2031 (USD Million)
Table 67 Germany: Sequencing Market, by Type, 2022–2031 (USD Million)
Table 68 Germany: Genomics Market, by Application, 2022–2031 (USD Million)
Table 69 Germany: Genomics Market for Life Science Research, by Type, 2022–2031 (USD Million)
Table 70 Germany: Genomics Market, by End User, 2022–2031 (USD Million)
Table 71 France: Genomics Market, by Offering, 2022–2031 (USD Million)
Table 72 France: Genomics Market, by Technology, 2022–2031 (USD Million)
Table 73 France: Sequencing Market, by Type, 2022–2031 (USD Million)
Table 74 France: Genomics Market, by Application, 2022–2031 (USD Million)
Table 75 France: Genomics Market for Life Science Research, by Type, 2022–2031 (USD Million)
Table 76 France: Genomics Market, by End User, 2022–2031 (USD Million)
Table 77 U.K.: Genomics Market, by Offering, 2022–2031 (USD Million)
Table 78 U.K.: Genomics Market, by Technology, 2022–2031 (USD Million)
Table 79 U.K.: Sequencing Market, by Type, 2022–2031 (USD Million)
Table 80 U.K.: Genomics Market, by Application, 2022–2031 (USD Million)
Table 81 U.K.: Genomics Market for Life Science Research, by Type, 2022–2031 (USD Million)
Table 82 U.K.: Genomics Market, by End User, 2022–2031 (USD Million)
Table 83 Italy: Genomics Market, by Offering, 2022–2031 (USD Million)
Table 84 Italy: Genomics Market, by Technology, 2022–2031 (USD Million)
Table 85 Italy: Sequencing Market, by Type, 2022–2031 (USD Million)
Table 86 Italy: Genomics Market, by Application, 2022–2031 (USD Million)
Table 87 Italy: Genomics Market for Life Science Research, by Type, 2022–2031 (USD Million)
Table 88 Italy: Genomics Market, by End User, 2022–2031 (USD Million)
Table 89 Spain: Genomics Market, by Offering, 2022–2031 (USD Million)
Table 90 Spain: Genomics Market, by Technology, 2022–2031 (USD Million)
Table 91 Spain: Sequencing Market, by Type, 2022–2031 (USD Million)
Table 92 Spain: Genomics Market, by Application, 2022–2031 (USD Million)
Table 93 Spain: Genomics Market for Life Science Research, by Type, 2022–2031 (USD Million)
Table 94 Spain: Genomics Market, by End User, 2022–2031 (USD Million)
Table 95 Rest of Europe: Genomics Market, by Offering, 2022–2031 (USD Million)
Table 96 Rest of Europe: Genomics Market, by Technology, 2022–2031 (USD Million)
Table 97 Rest of Europe: Sequencing Market, by Type, 2022–2031 (USD Million)
Table 98 Rest of Europe: Genomics Market, by Application, 2022–2031 (USD Million)
Table 99 Rest of Europe: Genomics Market for Life Science Research, by Type, 2022–2031 (USD Million)
Table 100 Rest of Europe: Genomics Market, by End User, 2022–2031 (USD Million)
Table 101 Asia-Pacific: Genomics Market, by Country/Region, 2022–2031 (USD Million)
Table 102 Asia-Pacific: Genomics Market, by Offering, 2022–2031 (USD Million)
Table 103 Asia-Pacific: Genomics Market, by Technology, 2022–2031 (USD Million)
Table 104 Asia-Pacific: Sequencing Market, by Type, 2022–2031 (USD Million)
Table 105 Asia-Pacific: Genomics Market, by Application, 2022–2031 (USD Million)
Table 106 Asia-Pacific: Genomics Market for Life Science Research, by Type, 2022–2031 (USD Million)
Table 107 Asia-Pacific: Genomics Market, by End User, 2022–2031 (USD Million)
Table 108 China: Genomics Market, by Offering, 2022–2031 (USD Million)
Table 109 China: Genomics Market, by Technology, 2022–2031 (USD Million)
Table 110 China: Sequencing Market, by Type, 2022–2031 (USD Million)
Table 111 China: Genomics Market, by Application, 2022–2031 (USD Million)
Table 112 China: Genomics Market for Life Science Research, by Type, 2022–2031 (USD Million)
Table 113 China: Genomics Market, by End User, 2022–2031 (USD Million)
Table 114 Japan: Genomics Market, by Offering, 2022–2031 (USD Million)
Table 115 Japan: Genomics Market, by Technology, 2022–2031 (USD Million)
Table 116 Japan: Sequencing Market, by Type, 2022–2031 (USD Million)
Table 117 Japan: Genomics Market, by Application, 2022–2031 (USD Million)
Table 118 Japan: Genomics Market for Life Science Research, by Type, 2022–2031 (USD Million)
Table 119 Japan: Genomics Market, by End User, 2022–2031 (USD Million)
Table 120 India: Genomics Market, by Offering, 2022–2031 (USD Million)
Table 121 India: Genomics Market, by Technology, 2022–2031 (USD Million)
Table 122 India: Sequencing Market, by Type, 2022–2031 (USD Million)
Table 123 India: Genomics Market, by Application, 2022–2031 (USD Million)
Table 124 India: Genomics Market for Life Science Research, by Type, 2022–2031 (USD Million)
Table 125 India: Genomics Market, by End User, 2022–2031 (USD Million)
Table 126 Rest of Asia-Pacific: Genomics Market, by Offering, 2022–2031 (USD Million)
Table 127 Rest of Asia-Pacific: Genomics Market, by Technology, 2022–2031 (USD Million)
Table 128 Rest of Asia-Pacific: Sequencing Market, by Type, 2022–2031 (USD Million)
Table 129 Rest of Asia-Pacific: Genomics Market, by Application, 2022–2031 (USD Million)
Table 130 Rest of Asia-Pacific: Genomics Market for Life Science Research, by Type, 2022–2031 (USD Million)
Table 131 Rest of Asia-Pacific: Genomics Market, by End User, 2022–2031 (USD Million)
Table 132 Latin America: Genomics Market, by Country/Region, 2022–2031 (USD Million)
Table 133 Latin America: Genomics Market, by Offering, 2022–2031 (USD Million)
Table 134 Latin America: Genomics Market, by Technology, 2022–2031 (USD Million)
Table 135 Latin America: Sequencing Market, by Type, 2022–2031 (USD Million)
Table 136 Latin America: Genomics Market, by Application, 2022–2031 (USD Million)
Table 137 Latin America: Genomics Market for Life Science Research, by Type, 2022–2031 (USD Million)
Table 138 Latin America: Genomics Market, by End User, 2022–2031 (USD Million)
Table 139 Brazil: Genomics Market, by Offering, 2022–2031 (USD Million)
Table 140 Brazil: Genomics Market, by Technology, 2022–2031 (USD Million)
Table 141 Brazil: Sequencing Market, by Type, 2022–2031 (USD Million)
Table 142 Brazil: Genomics Market, by Application, 2022–2031 (USD Million)
Table 143 Brazil: Genomics Market for Life Science Research, by Type, 2022–2031 (USD Million)
Table 144 Brazil: Genomics Market, by End User, 2022–2031 (USD Million)
Table 145 Mexico: Genomics Market, by Offering, 2022–2031 (USD Million)
Table 146 Mexico: Genomics Market, by Technology, 2022–2031 (USD Million)
Table 147 Mexico: Sequencing Market, by Type, 2022–2031 (USD Million)
Table 148 Mexico: Genomics Market, by Application, 2022–2031 (USD Million)
Table 149 Mexico: Genomics Market for Life Science Research, by Type, 2022–2031 (USD Million)
Table 150 Mexico: Genomics Market, by End User, 2022–2031 (USD Million)
Table 151 Rest of Latin America: Genomics Market, by Offering, 2022–2031 (USD Million)
Table 152 Rest of Latin America: Genomics Market, by Technology, 2022–2031 (USD Million)
Table 153 Rest of Latin America: Sequencing Market, by Type, 2022–2031 (USD Million)
Table 154 Rest of Latin America: Genomics Market, by Application, 2022–2031 (USD Million)
Table 155 Rest of Latin America: Genomics Market for Life Science Research, by Type, 2022–2031 (USD Million)
Table 156 Rest of Latin America: Genomics Market, by End User, 2022–2031 (USD Million)
Table 157 Middle East & Africa: Genomics Market, by Offering, 2022–2031 (USD Million)
Table 158 Middle East & Africa: Genomics Market, by Technology, 2022–2031 (USD Million)
Table 159 Middle East & Africa: Sequencing Market, by Type, 2022–2031 (USD Million)
Table 160 Middle East & Africa: Genomics Market, by Application, 2022–2031 (USD Million)
Table 161 Middle East & Africa: Genomics Market for Life Science Research, by Type, 2022–2031 (USD Million)
Table 162 Middle East & Africa: Genomics Market, by End User, 2022–2031 (USD Million)
Table 163 Recent Developments, by Company, 2020–2024
List of Figures
Figure 1 Research Process
Figure 2 Secondary Sources Referred for This Study
Figure 3 Primary Research Techniques
Figure 4 Key Executives Interviewed
Figure 5 Breakdown of Primary Interviews (Supply Side & Dem and Side)
Figure 6 Market Sizing and Growth Forecast Approach
Figure 7 Global Genomics Market, by Offering, 2024 Vs. 2031 (USD Million)
Figure 8 Global Genomics Market, by Technology, 2024 Vs. 2031 (USD Million)
Figure 9 Global Genomics Market, by Application, 2024 Vs. 2031 (USD Million)
Figure 10 Global Genomics Market, by End User, 2024 Vs. 2031 (USD Million)
Figure 11 Genomics Market, by Geography
Figure 12 Impact Analysis of Market Dynamics
Figure 13 Healthcare Expenditure as A Percentage of GDP in Major Countries, 2015 Vs. 2020
Figure 14 Global Pharmaceutical R&D Expenditure, 2012–2022 (USD Billion)
Figure 15 Estimated Number of New Cancer Cases, by Region, 2020 Vs. 2030 (in Thousand)
Figure 16 Percentage of FDA Approvals for Personalized Medicine, 2015-2021
Figure 17 USFDA Regulatory Pathways for Genomic Products
Figure 18 EU Regulatory Pathway IVDR 2017/746
Figure 19 China: Medical Device Classification and Pre-Market Requirements for IVD Devices
Figure 20 Porter's Five Forces Analysis
Figure 21 Global Genomics Market, by Offering, 2024 Vs. 2031 (USD Million)
Figure 22 Global Genomics Market, by Technology, 2024 Vs. 2031 (USD Million)
Figure 23 Global Genomics Market, by Application, 2024 Vs. 2031 (USD Million)
Figure 24 Global Pharmaceutical R&D Expenditure, 2014—2026 (USD Billion)
Figure 25 Cancer Incidence Cases, 2020 Vs. 2040
Figure 26 Global Genomics Market, by End User, 2024 Vs. 2031 (USD Million)
Figure 27 Global Pharmaceutical R&D Spending, 2012–2026 (USD Billion)
Figure 28 Global Genomics Market Assessment, by Region, 2024 Vs. 2031 (USD Million)
Figure 29 North America: Genomics Market Snapshot
Figure 30 Europe: Genomics Market Snapshot
Figure 31 Asia-Pacific: Genomics Market Snapshot
Figure 32 Latin America: Genomics Market Snapshot
Figure 33 Key Growth Strategies Adopted by Leading Players, 2020–2023
Figure 34 Genomics Market: Competitive Benchmarking, by Offering
Figure 35 Genomics Market: Competitive Benchmarking, by Geography
Figure 36 Competitive Dashboard: Genomics Market
Figure 37 Global Genomics Market Share Analysis, by Key Players
Figure 38 Thermo Fisher Scientific, Inc.: Financial Overview (2022)
Figure 39 Illumina, Inc.: Financial Overview (2022)
Figure 40 Qiagen N.V.: Financial Overview (2022)
Figure 41 Danaher Corporation: Financial Overview (2022)
Figure 42 Agilent Technologies, Inc.: Financial Overview (2023)
Figure 43 Bio-Rad Laboratories, Inc.: Financial Overview (2022)
Figure 44 Pacific Biosciences of California, Inc.: Financial Overview (2022)
Figure 45 Oxford Nanopore Technologies plc.: Financial Overview (2022)
Figure 46 Eppendorf SE: Financial Overview (2022)
Figure 47 Myriad Genetics, Inc.: Financial Overview (2022)
Figure 48 PerkinElmer, Inc.: Financial Overview (2022)
Figure 49 BGI Genomics Co.,Ltd.: Financial Overview (2022)
Published Date: May-2024
Published Date: Jan-2024
Published Date: Aug-2017
Published Date: Jan-2024
Please enter your corporate email id here to view sample report.
Subscribe to get the latest industry updates