Resources
About Us
DTC Food Market by Type (Food {Bakery & Confectionery, Meat, Poultry, & Seafood, Dairy, Snacks}, Beverages {Carbonated Soft Drinks & Juices, RTD Tea & Coffee, Alcoholic Beverages}), by Distribution Channel (Online, Offline) - Global Forecast to 2031
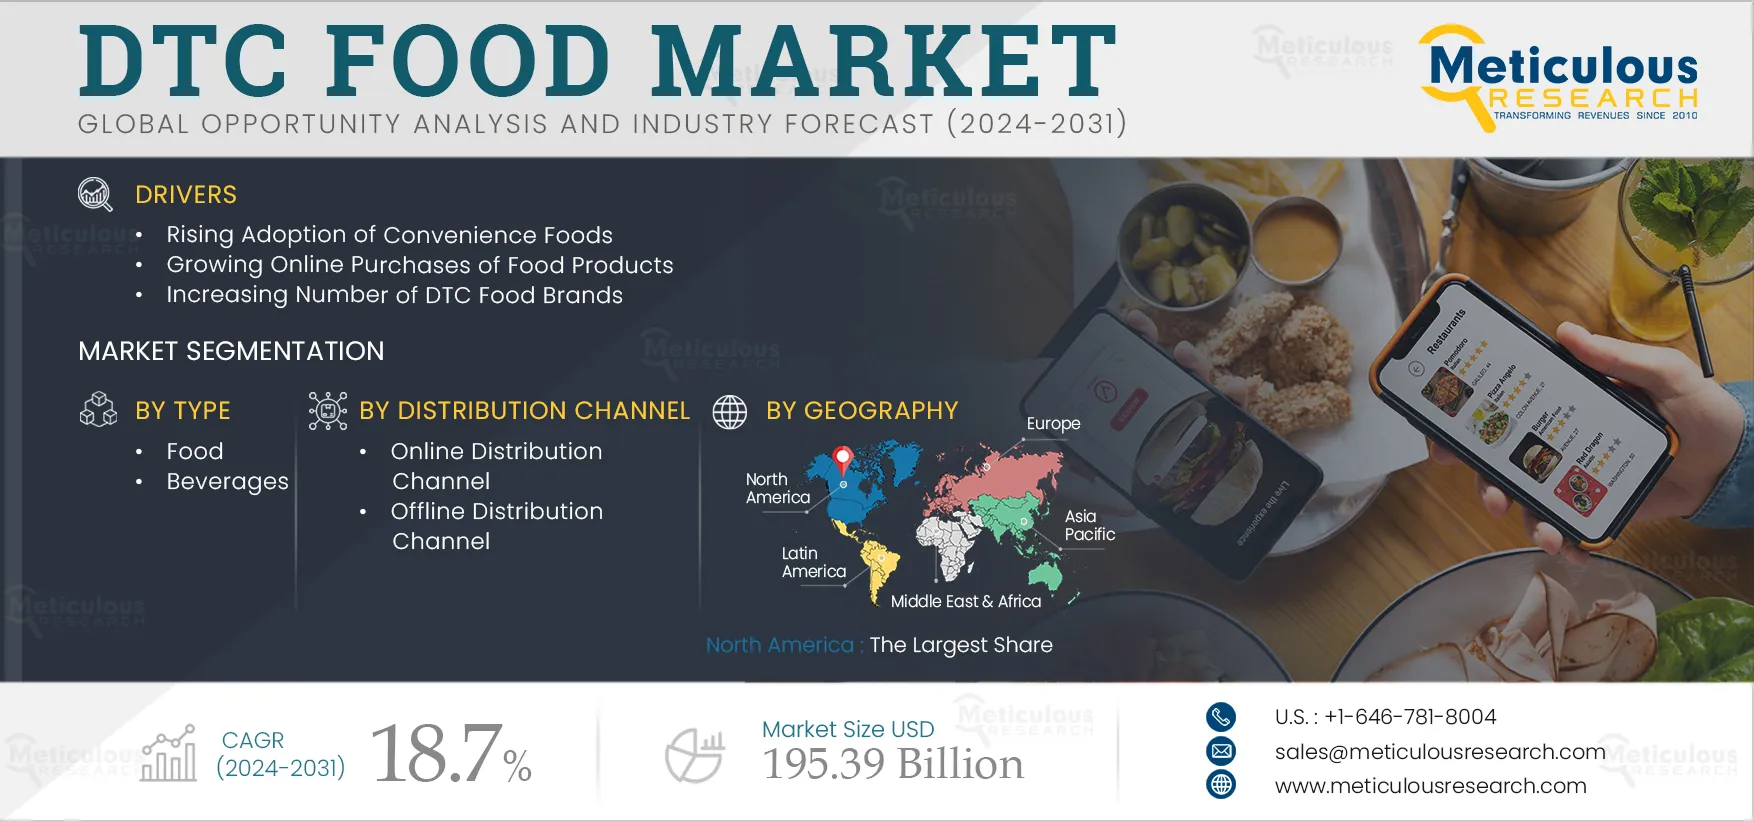
Report ID: MRFB - 1041087 Pages: 204 Jan-2024 Formats*: PDF Category: Food and Beverages Delivery: 2 to 4 Hours Download Free Sample ReportThe growth of this market is driven by the rising adoption of convenience foods, growing online purchases of food products, and the increasing number of DTC food brands. However, the lack of brand awareness & limited product offerings of DTC food providers, and product quality concerns & delivery delays are factors restraining the growth of this market to some extent. The growing demand for premium & personalized food products is expected to generate market growth opportunities. However, high competition from other distribution channels is a major challenge for the players operating in this market. Furthermore, consumers’ increasing focus on health and wellness is a major trend in the DTC food market.
The report offers a competitive analysis based on an extensive assessment of the leading players’ product portfolios, geographic presence, and key growth strategies adopted in the last 3–4 years. Some of the key players operating in the DTC food market are Anheuser–Busch InBev NV/SA (Belgium), AriZona Beverages USA, LLC (U.S.), JBS S.A. (Brazil), Mondelēz International, Inc. (U.S.), Nestlé S.A. (Switzerland), OLIPOP, Inc (U.S.), PepsiCo, Inc. (U.S.), The Coca-Cola Company (U.S.), The Kraft Heinz Company (U.S.), The Naked Market (U.S.), and Unilever PLC (U.K.).
During the last decade, the food and beverage industry has transformed significantly due to growth in online grocery shopping and direct-to-consumer sales. Nowadays, consumers seek convenience and personalization in their food options. Online food purchases are increasing globally, resulting from consumers’ increasing access to the internet and growing smartphone usage. According to the Food and Agriculture Organization (FAO), e-commerce has skyrocketed in the food industry since 2020 due to the COVID-19 pandemic. Moreover, consumers’ increasing preference for purchasing food products online is driving a digital revolution in the food industry. Thus, growing urbanization, rising disposable incomes, changing lifestyles, and the increasing number of working professionals are driving online sales of food & beverage products.
DTC brands use their own websites for online sales, allowing them to establish direct relationships with consumers without the involvement of intermediaries. Thus, they can communicate directly with consumers, gather feedback, and build brand loyalty. Moreover, this also allows DTC food manufacturers to innovate and keep pace with trending consumer interests. For instance, consumers are growing increasingly interested in plant-based foods due to concerns such as environmental sustainability, food allergies & intolerances, and animal welfare. As a result, many food start-ups and some established key players are investing in plant-based foods, selling their products directly from their websites, and taking feedback from consumers. Food manufacturers are focusing on innovating their products with new flavors and ingredients to cater to consumer preferences. Online distribution is enabling DTC food brands to expand their reach beyond local markets and serve customers nationally and internationally. This shift to online sales is helping DTC food manufacturers broaden their customer bases and increase business sustainability. Thus, increasing online purchases are supporting the growth of the DTC food market.
Based on type, the global DTC food market is segmented into food and beverages. In 2024, the food segment is expected to account for the larger share of the global DTC food market. The large market share of this segment is attributed to the growing demand for convenience foods, changes in lifestyle and food habits, increasing consumer inclination towards online shopping, growing demand for nutritional and fortifying food products, rising innovative food products, and rising spending on healthy and nutritious diets.
However, the beverages segment is expected to register a higher CAGR during the forecast period of 2024–2031. The growth of this segment is mainly attributed to the rising consumer demand for healthier and more premium beverage products, changing consumer preferences, increasing demand for low-calorie beverages, and growing popularity for plant-based and functional beverages among consumers.
Based on distribution channel, the DTC food market is segmented into online distribution channel and offline distribution channel. In 2024, the online distribution channel segment is expected to account for the larger share of the DTC food market. The large market share of this segment is attributed to the increasing preference for online shopping among consumers, the convenience offered by online platforms, the growing penetration of the internet, and the high popularity among food and beverage manufacturers of creating websites to display and sell their products directly to consumers. Moreover, the growing preference for personalization, contactless shopping, consumer convenience, easy price comparisons between brands, the advantage of greater discounts compared to offline stores, and a greater product selection experience are some of the factors further increasing the popularity of the online distribution of the food and beverage products.
Moreover, this segment is further projected to register a higher CAGR during the forecast period of 2024–2031, as the COVID-19 pandemic has further accelerated the shift towards online shopping as consumers prioritize safety and contactless transactions.
Based on geography, the global DTC food market is divided into five major regions: North America, Asia-Pacific, Europe, Latin America, and the Middle East & Africa. In 2024, North America is expected to account for the largest share of the global DTC food market. The large market share of this region is mainly attributed to the growing consumer awareness and preference for direct-to-consumer food products, increasing popularity of online food purchasing, presence of a large number of key food and beverage brands following direct-to-consumer business models, and rising consumer awareness about the online platforms of the brands.
Additionally, this region is further slated to register the highest CAGR during the forecast period of 2024–2031. The fast growth of this region is mainly attributed to the rising technological advancements in online food distribution and high consumer preference for convenience and personalized shopping experiences. Moreover, factors such as busy lifestyles, increasing disposable income, and a growing demand for healthy and sustainable food options are also expected to support the high growth of the DTC food market in North America.
Particulars |
Details |
Number of Pages |
204 |
Format |
|
Forecast Period |
2024–2031 |
Base Year |
2023 |
CAGR |
18.7% |
Estimated Market Size (Value) |
$195.39 Billion by 2031 |
Segments Covered |
By Type
By Distribution Channel
|
Countries Covered |
North America (U.S., Canada), Europe (U.K., Germany, France, Italy, Spain, and Rest of Europe), Asia-Pacific (China, Japan, India, Australia, and Rest of Asia-Pacific), Latin America (Brazil, Mexico, Argentina, and Rest of Latin America), and the Middle East & Africa |
Key Companies |
Anheuser–Busch InBev NV/SA (Belgium), AriZona Beverages USA, LLC (U.S.), JBS S.A. (Brazil), Mondelēz International, Inc. (U.S.), Nestlé S.A. (Switzerland), OLIPOP, Inc (U.S.), PepsiCo, Inc. (U.S.), The Coca-Cola Company (U.S.), The Kraft Heinz Company (U.S.), The Naked Market (U.S.), and Unilever PLC (U.K.) |
DTC or Direct-to-Consumer refers to a business model where a food company sells its products directly to consumers without relying on any third-party retailers, wholesalers, or other intermediaries (E-commerce websites). In the context of the food market, DTC food refers to food products that are sold directly to consumers by the manufacturers/producers themselves, typically through online platforms and physical stores owned by the food producers. This market encompasses various food and beverage products, including snacks, bakery products, dairy, fresh produce, meat, specialty items, and beverages, all of which are offered directly to consumers through their own websites and physical stores.
In this Global DTC Food Market study, the market size in terms of value is calculated by considering the revenue generated by food and beverage product manufacturers by selling their food and beverage products directly to consumers only through their website and at their exclusive stores at the global level. This study primarily provides a detailed market assessment and valuable insights (in terms of value) for the DTC food and beverage products, including type, distribution channel, and various countries across the different regions.
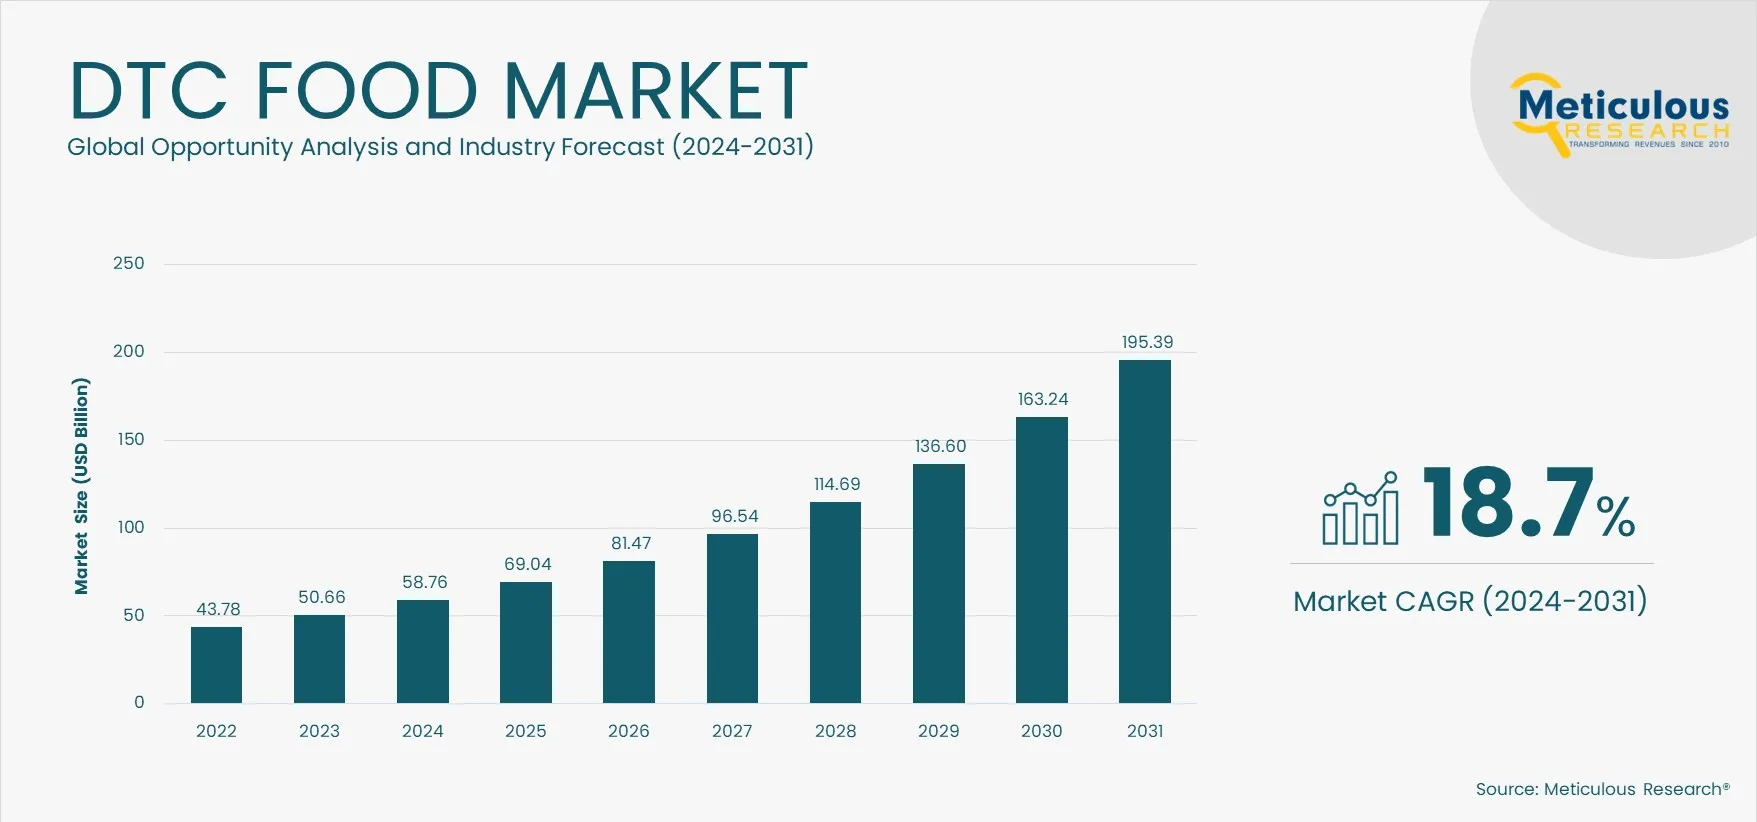
The DTC food market is projected to reach $195.39 billion by 2031, at a CAGR of 18.7% during the forecast period 2024–2031.
Based on distribution channel, the online distribution channel segment is projected to record a higher growth rate during the forecast period 2024–2031.
o Rising Adoption of Convenience Foods
o Growing Online Purchases of Food Products
o Increasing Number of DTC Food Brands
o Lack of Brand Awareness & Limited Product Offerings of DTC Food Providers
o Product Quality Concerns & Delivery Delays
The key players operating in the DTC food market are Anheuser–Busch InBev NV/SA (Belgium), AriZona Beverages USA, LLC (U.S.), JBS S.A. (Brazil), Mondel?z International, Inc. (U.S.), Nestlé S.A. (Switzerland), OLIPOP, Inc (U.S.), PepsiCo, Inc. (U.S.), The Coca-Cola Company (U.S.), The Kraft Heinz Company (U.S.), The Naked Market (U.S.), and Unilever PLC (U.K.).
North America is projected to record the highest CAGR during the forecast period due to the rising technological advancements in online food distribution and high consumer preference for convenience and personalized shopping experiences. Moreover, factors such as busy lifestyles, increasing disposable income, and a growing demand for healthy and sustainable food options are also expected to support the high growth of the DTC food market in North America.
1. Introduction
1.1. Market Definition & Scope
1.2. Market Ecosystem
1.3. Currency
1.4. Key Stakeholders
2. Research Methodology
2.1. Research Approach
2.2. Data Collection & Validation Process
2.2.1. Secondary Research
2.2.2. Primary Research/Interviews with Key Opinion Leaders of the Industry
2.3. Market Sizing and Forecast
2.3.1. Market Size Estimation Approach
2.3.2. Growth Forecast Approach
2.4. Assumptions for the Study
3. Executive Summary
3.1. Overview
3.2. Segmental Analysis
3.2.1. DTC Food Market Analysis: by Type
3.2.2. DTC Food Market Analysis: by Distribution Channel
3.3. Regional Analysis
3.4. Competitive Landscape
4. Market Insights
4.1. Overview
4.2. Factors Affecting Market Growth
4.2.1. Rising Adoption of Convenience Foods Driving the Demand for DTC Food & Beverage Products
4.2.2. Growing Online Purchases of Food Products Supporting Market Growth
4.2.3. Increasing Number of DTC Food Brands Accelerating Market Expansion
4.2.4. Lack of Brand Awareness & Limited Product Offerings of DTC Food Providers Limiting Market Growth
4.2.5. Quality Concerns & Delivery Delays Impacting the Adoption of DTC Food Products
4.2.6. Growing Demand for Premium & Personalized Food Products Generating Market Growth Opportunities
4.2.7. High Competition from Other Distribution Channels to Remain a Major Challenge for Market Players
4.3. Key Trends
4.3.1. Consumers’ Increasing Focus on Health & Wellness
4.4. Porter’s Five Forces Analysis
4.4.1. Bargaining Power of Suppliers
4.4.2. Bargaining Power of Buyers
4.4.3. Threat of Substitutes
4.4.4. Threat of New Entrants
4.4.5. Degree of Competition
5. DTC Food Market Assessment—by Type
5.1. Overview
5.2. Food
5.2.1. Bakery & Confectionery Products
5.2.2. Meat, Poultry, and Seafood Products
5.2.3. Snacks
5.2.4. Dairy Products
5.2.5. Sauces, Dressings, and Condiments
5.2.6. Breakfast Cereals
5.2.7. Infant Food
5.2.8. Other Food Products
5.3. Beverages
5.3.1. Non-alcoholic Beverages
5.3.1.1. Carbonated Soft Drinks & Juices
5.3.1.2. Dairy & Dairy Alternative Beverages
5.3.1.3. Sports & Energy Drinks
5.3.1.4. RTD Tea & Coffee
5.3.1.5. Flavored & Fortified Water
5.3.2. Alcoholic Beverages
6. DTC Food Market Assessment—by Distribution Channel
6.1. Overview
6.2. Online Distribution Channel
6.3. Offline Distribution Channel
7. DTC Food Market Assessment—by Geography
7.1. Overview
7.2. North America
7.2.1. U.S.
7.2.2. Canada
7.3. Europe
7.3.1. U.K.
7.3.2. Germany
7.3.3. France
7.3.4. Italy
7.3.5. Spain
7.3.6. Rest of Europe
7.4. Asia-Pacific
7.4.1. China
7.4.2. Japan
7.4.3. India
7.4.4. Australia
7.4.5. Rest of Asia-Pacific
7.5. Latin America
7.5.1. Brazil
7.5.2. Mexico
7.5.3. Argentina
7.5.4. Rest of Latin America
7.6. Middle East & Africa
8. Competition Analysis
8.1. Overview
8.2. Key Growth Strategies
8.3. Competitive Benchmarking
8.4. Competitive Dashboard
8.4.1. Industry Leaders
8.4.2. Market Differentiators
8.4.3. Vanguards
8.4.4. Emerging Companies
9. Company Profiles
9.1. Anheuser–Busch InBev NV/SA
9.1.1. Company Overview
9.1.2. Financial Overview
9.1.3. SWOT Analysis: Anheuser–Busch InBev NV/SA
9.1.4. Product Portfolio
9.1.5. Strategic Developments
9.2. AriZona Beverages USA, LLC.
9.2.1. Company Overview
9.2.2. Product Portfolio
9.3. JBS S.A.
9.3.1. Company Overview
9.3.2. Financial Overview
9.3.3. Product Portfolio
9.3.4. Strategic Developments
9.4. Mondelēz International, Inc.
9.4.1. Company Overview
9.4.2. Financial Overview
9.4.3. SWOT Analysis: Mondelēz International, Inc.
9.4.4. Product Portfolio
9.4.5. Strategic Developments
9.5. Nestlé S.A.
9.5.1. Company Overview
9.5.2. Financial Overview
9.5.3. SWOT Analysis: Nestlé S.A.
9.5.4. Product Portfolio
9.5.5. Strategic Developments
9.6. OLIPOP, Inc
9.6.1. Company Overview
9.6.2. Product Portfolio
9.6.3. Strategic Developments
9.7. PepsiCo, Inc.
9.7.1. Company Overview
9.7.2. Financial Overview
9.7.3. SWOT Analysis: PepsiCo, Inc.
9.7.4. Product Portfolio
9.7.5. Strategic Developments
9.8. The Coca-Cola Company
9.8.1. Company Overview
9.8.2. Financial Overview
9.8.3. SWOT Analysis: The Coca-Cola Company
9.8.4. Product Portfolio
9.8.5. Strategic Developments
9.9. The Kraft Heinz Company
9.9.1. Company Overview
9.9.2. Financial Overview
9.9.3. Product Portfolio
9.9.4. Strategic Developments
9.10. The Naked Market
9.10.1. Company Overview
9.10.2. Product Portfolio
9.10.3. Strategic Developments
9.11. Unilever PLC
9.11.1. Company Overview
9.11.2. Financial Overview
9.11.3. Product Portfolio
10. Appendix
10.1. Available Customization
10.2. Related Reports
List of Tables
Table 1 Global DTC Food Market, by Type, 2022–2031 (USD Million)
Table 2 Global DTC Food Market, by Type, 2022–2031 (USD Million)
Table 3 Global DTC Food Market, by Country/Region, 2022–2031 (USD Million)
Table 4 Global DTC Bakery and Confectionery Products Market, by Country/Region, 2022–2031 (USD Million)
Table 5 Global DTC Meat, Poultry, and Seafood Products Market, by Country/Region, 2022–2031 (USD Million)
Table 6 Global DTC Snacks Market, by Country/Region, 2022–2031 (USD Million)
Table 7 Global DTC Dairy Products Market, by Country/Region, 2022–2031 (USD Million)
Table 8 Global DTC Sauces, Dressings, and Condiments Market, by Country/Region, 2022–2031 (USD Million)
Table 9 Global DTC Breakfast Cereals Market, by Country/Region, 2022–2031 (USD Million)
Table 10 Global DTC Infant Food Market, by Country/Region, 2022–2031 (USD Million)
Table 11 Global Other DTC Food Products Market, by Country/Region, 2022–2031 (USD Million)
Table 12 Global DTC Beverages Market, by Type, 2022–2031 (USD Million)
Table 13 Global DTC Beverages Market, by Country/Region, 2022–2031 (USD Million)
Table 14 Global DTC Non-alcoholic Beverages Market, by Type, 2022–2031 (USD Million)
Table 15 Global DTC Non-alcoholic Beverages Market, by Country/Region, 2022–2031 (USD Million)
Table 16 Global DTC Carbonated Soft Drinks & Juices Market, by Country/Region, 2022–2031 (USD Million)
Table 17 Global DTC Dairy & Dairy Alternative Beverages Market, by Country/Region, 2022–2031 (USD Million)
Table 18 Global DTC Sports & Energy Drinks Market, by Country/Region, 2022–2031 (USD Million)
Table 19 Global DTC RTD Tea & Coffee Market, by Country/Region, 2022–2031 (USD Million)
Table 20 Global DTC Flavored & Fortified Water Market, by Country/Region, 2022–2031 (USD Million)
Table 21 Global DTC Alcoholic Beverages Market, by Country/Region, 2022–2031 (USD Million)
Table 22 Global DTC Food Market, by Distribution Channel, 2022–2031 (USD Million)
Table 23 Global DTC Food Market for Online Distribution Channel, by Country/Region, 2022–2031 (USD Million)
Table 24 Global DTC Food Market for Offline Distribution Channel, by Country/Region, 2022–2031 (USD Million)
Table 25 Global DTC Food Market, by Country/Region, 2022–2031 (USD Million)
Table 26 North America: DTC Food Market, by Country, 2022–2031 (USD Million)
Table 27 North America: DTC Food Market, by Type, 2022–2031 (USD Million)
Table 28 North America: DTC Food Products Market, by Type, 2022–2031 (USD Million)
Table 29 North America: DTC Beverages Market, by Type, 2022–2031 (USD Million)
Table 30 North America: DTC Non-alcoholic Beverages Market, by Type, 2022–2031 (USD Million)
Table 31 North America: DTC Food Market, by Distribution Channel, 2022–2031 (USD Million)
Table 32 U.S.: DTC Food Market, by Type, 2022–2031 (USD Million)
Table 33 U.S.: DTC Food Products Market, by Type, 2022–2031 (USD Million)
Table 34 U.S.: DTC Beverages Market, by Type, 2022–2031 (USD Million)
Table 35 U.S.: DTC Non-alcoholic Beverages Market, by Type, 2022–2031 (USD Million)
Table 36 U.S.: DTC Food Market, by Distribution Channel, 2022–2031 (USD Million)
Table 37 Canada: DTC Food Market, by Type, 2022–2031 (USD Million)
Table 38 Canada: DTC Food Products Market, by Type, 2022–2031 (USD Million)
Table 39 Canada: DTC Beverages Market, by Type, 2022–2031 (USD Million)
Table 40 Canada: DTC Non-alcoholic Beverages Market, by Type, 2022–2031 (USD Million)
Table 41 Canada: DTC Food Market, by Distribution Channel, 2022–2031 (USD Million)
Table 42 Europe: DTC Food Market, by Country/Region, 2022–2031 (USD Million)
Table 43 Europe: DTC Food Market, by Type, 2022–2031 (USD Million)
Table 44 Europe: DTC Food Products Market, by Type, 2022–2031 (USD Million)
Table 45 Europe: DTC Beverages Market, by Type, 2022–2031 (USD Million)
Table 46 Europe: DTC Non-alcoholic Beverages Market, by Type, 2022–2031 (USD Million)
Table 47 Europe: DTC Food Market, by Distribution Channel, 2022–2031 (USD Million)
Table 48 U.K.: DTC Food Market, by Type, 2022–2031 (USD Million)
Table 49 U.K.: DTC Food Products Market, by Type, 2022–2031 (USD Million)
Table 50 U.K.: DTC Beverages Market, by Type, 2022–2031 (USD Million)
Table 51 U.K.: DTC Non-alcoholic Beverages Market, by Type, 2022–2031 (USD Million)
Table 52 U.K.: DTC Food Market, by Distribution Channel, 2022–2031 (USD Million)
Table 53 Germany: DTC Food Market, by Type, 2022–2031 (USD Million)
Table 54 Germany: DTC Food Products Market, by Type, 2022–2031 (USD Million)
Table 55 Germany: DTC Beverages Market, by Type, 2022–2031 (USD Million)
Table 56 Germany: DTC Non-alcoholic Beverages Market, by Type, 2022–2031 (USD Million)
Table 57 Germany: DTC Food Market, by Distribution Channel, 2022–2031 (USD Million)
Table 58 France: DTC Food Market, by Type, 2022–2031 (USD Million)
Table 59 France: DTC Food Products Market, by Type, 2022–2031 (USD Million)
Table 60 France: DTC Beverages Market, by Type, 2022–2031 (USD Million)
Table 61 France: DTC Non-alcoholic Beverages Market, by Type, 2022–2031 (USD Million)
Table 62 France: DTC Food Market, by Distribution Channel, 2022–2031 (USD Million)
Table 63 Italy: DTC Food Market, by Type, 2022–2031 (USD Million)
Table 64 Italy: DTC Food Products Market, by Type, 2022–2031 (USD Million)
Table 65 Italy: DTC Beverages Market, by Type, 2022–2031 (USD Million)
Table 66 Italy: DTC Non-alcoholic Beverages Market, by Type, 2022–2031 (USD Million)
Table 67 Italy: DTC Food Market, by Distribution Channel, 2022–2031 (USD Million)
Table 68 Spain: DTC Food Market, by Type, 2022–2031 (USD Million)
Table 69 Spain: DTC Food Products Market, by Type, 2022–2031 (USD Million)
Table 70 Spain: DTC Beverages Market, by Type, 2022–2031 (USD Million)
Table 71 Spain: DTC Non-alcoholic Beverages Market, by Type, 2022–2031 (USD Million)
Table 72 Spain: DTC Food Market, by Distribution Channel, 2022–2031 (USD Million)
Table 73 Rest of Europe: DTC Food Market, by Type, 2022–2031 (USD Million)
Table 74 Rest of Europe: DTC Food Products Market, by Type, 2022–2031 (USD Million)
Table 75 Rest of Europe: DTC Beverages Market, by Type, 2022–2031 (USD Million)
Table 76 Rest of Europe: DTC Non-alcoholic Beverages Market, by Type, 2022–2031 (USD Million)
Table 77 Rest of Europe: DTC Food Market, by Distribution Channel, 2022–2031 (USD Million)
Table 78 Asia-Pacific: DTC Food Market, by Country/Region, 2022–2031 (USD Million)
Table 79 Asia-Pacific: DTC Food Market, by Type, 2022–2031 (USD Million)
Table 80 Asia-Pacific: DTC Food Products Market, by Type, 2022–2031 (USD Million)
Table 81 Asia-Pacific: DTC Beverages Market, by Type, 2022–2031 (USD Million)
Table 82 Asia-Pacific: DTC Non-alcoholic Beverages Market, by Type, 2022–2031 (USD Million)
Table 83 Asia-Pacific: DTC Food Market, by Distribution Channel, 2022–2031 (USD Million)
Table 84 China: DTC Food Market, by Type, 2022–2031 (USD Million)
Table 85 China: DTC Food Products Market, by Type, 2022–2031 (USD Million)
Table 86 China: DTC Beverages Market, by Type, 2022–2031 (USD Million)
Table 87 China: DTC Non-alcoholic Beverages Market, by Type, 2022–2031 (USD Million)
Table 88 China: DTC Food Market, by Distribution Channel, 2022–2031 (USD Million)
Table 89 Japan: DTC Food Market, by Type, 2022–2031 (USD Million)
Table 90 Japan: DTC Food Products Market, by Type, 2022–2031 (USD Million)
Table 91 Japan: DTC Beverages Market, by Type, 2022–2031 (USD Million)
Table 92 Japan: DTC Non-alcoholic Beverages Market, by Type, 2022–2031 (USD Million)
Table 93 Japan: DTC Food Market, by Distribution Channel, 2022–2031 (USD Million)
Table 94 India: DTC Food Market, by Type, 2022–2031 (USD Million)
Table 95 India: DTC Food Products Market, by Type, 2022–2031 (USD Million)
Table 96 India: DTC Beverages Market, by Type, 2022–2031 (USD Million)
Table 97 India: DTC Non-alcoholic Beverages Market, by Type, 2022–2031 (USD Million)
Table 98 India: DTC Food Market, by Distribution Channel, 2022–2031 (USD Million)
Table 99 Australia: DTC Food Market, by Type, 2022–2031 (USD Million)
Table 100 Australia: DTC Food Products Market, by Type, 2022–2031 (USD Million)
Table 101 Australia: DTC Beverages Market, by Type, 2022–2031 (USD Million)
Table 102 Australia: DTC Non-alcoholic Beverages Market, by Type, 2022–2031 (USD Million)
Table 103 Australia: DTC Food Market, by Distribution Channel, 2022–2031 (USD Million)
Table 104 Rest of Asia-Pacific: DTC Food Market, by Type, 2022–2031 (USD Million)
Table 105 Rest of Asia-Pacific: DTC Food Products Market, by Type, 2022–2031 (USD Million)
Table 106 Rest of Asia-Pacific: DTC Beverages Market, by Type, 2022–2031 (USD Million)
Table 107 Rest of Asia-Pacific: DTC Non-alcoholic Beverages Market, by Type, 2022–2031 (USD Million)
Table 108 Rest of Asia-Pacific: DTC Food Market, by Distribution Channel, 2022–2031 (USD Million)
Table 109 Latin America: DTC Food Market, by Country/Region, 2022–2031 (USD Million)
Table 110 Latin America: DTC Food Market, by Type, 2022–2031 (USD Million)
Table 111 Latin America: DTC Food Products Market, by Type, 2022–2031 (USD Million)
Table 112 Latin America: DTC Beverages Market, by Type, 2022–2031 (USD Million)
Table 113 Latin America: DTC Non-alcoholic Beverages Market, by Type, 2022–2031 (USD Million)
Table 114 Latin America: DTC Food Market, by Distribution Channel, 2022–2031 (USD Million)
Table 115 Brazil: DTC Food Market, by Type, 2022–2031 (USD Million)
Table 116 Brazil: DTC Food Products Market, by Type, 2022–2031 (USD Million)
Table 117 Brazil: DTC Beverages Market, by Type, 2022–2031 (USD Million)
Table 118 Brazil: DTC Non-alcoholic Beverages Market, by Type, 2022–2031 (USD Million)
Table 119 Brazil: DTC Food Market, by Distribution Channel, 2022–2031 (USD Million)
Table 120 Mexico: DTC Food Market, by Type, 2022–2031 (USD Million)
Table 121 Mexico: DTC Food Products Market, by Type, 2022–2031 (USD Million)
Table 122 Mexico: DTC Beverages Market, by Type, 2022–2031 (USD Million)
Table 123 Mexico: DTC Non-alcoholic Beverages Market, by Type, 2022–2031 (USD Million)
Table 124 Mexico: DTC Food Market, by Distribution Channel, 2022–2031 (USD Million)
Table 125 Argentina: DTC Food Market, by Type, 2022–2031 (USD Million)
Table 126 Argentina: DTC Food Products Market, by Type, 2022–2031 (USD Million)
Table 127 Argentina: DTC Beverages Market, by Type, 2022–2031 (USD Million)
Table 128 Argentina: DTC Non-alcoholic Beverages Market, by Type, 2022–2031 (USD Million)
Table 129 Argentina: DTC Food Market, by Distribution Channel, 2022–2031 (USD Million)
Table 130 Rest of Latin America: DTC Food Market, by Type, 2022–2031 (USD Million)
Table 131 Rest of Latin America: DTC Food Products Market, by Type, 2022–2031 (USD Million)
Table 132 Rest of Latin America: DTC Beverages Market, by Type, 2022–2031 (USD Million)
Table 133 Rest of Latin America: DTC Non-alcoholic Beverages Market, by Type, 2022–2031 (USD Million)
Table 134 Rest of Latin America: DTC Food Market, by Distribution Channel, 2022–2031 (USD Million)
Table 135 Middle East & Africa: DTC Food Market, by Type, 2022–2031 (USD Million)
Table 136 Middle East & Africa: DTC Food Products Market, by Type, 2022–2031 (USD Million)
Table 137 Middle East & Africa: DTC Beverages Market, by Type, 2022–2031 (USD Million)
Table 138 Middle East & Africa: DTC Non-alcoholic Beverages Market, by Type, 2022–2031 (USD Million)
Table 139 Middle East & Africa: DTC Food Market, by Distribution Channel, 2022–2031 (USD Million)
Table 140 Recent Developments, by Company (2020–2023)
List of Figures
Figure 1 Research Process
Figure 2 Secondary Sources Referenced for this Study
Figure 3 Primary Research Techniques
Figure 4 Key Executives Interviewed
Figure 5 Breakdown of Primary Interviews (Supply Side & Demand Side)
Figure 6 Market Sizing and Growth Forecast Approach
Figure 7 The Food Segment is Expected to Dominate the Global DTC Food Market in 2024
Figure 8 The Online Distribution Channel is Expected to Dominate the Global DTC Food Market in 2024
Figure 9 North America: Lucrative and Growing Market for DTC Food Market Stakeholders
Figure 10 Impact Analysis of Market Dynamics
Figure 11 DTC Food Market: Porter’s Five Forces Analysis
Figure 12 Global DTC Food Market, by Type, 2024 Vs. 2031 (USD Million)
Figure 13 Global DTC Food Market, by Type, 2024 Vs. 2031 (USD Million)
Figure 14 Global DTC Beverages Market, by Type, 2024 Vs. 2031 (USD Million)
Figure 15 Global DTC Non-alcoholic Beverages Market, by Type, 2024 Vs. 2031 (USD Million)
Figure 16 Global DTC Food Market, by Distribution Channel, 2024 Vs. 2031 (USD Million)
Figure 17 Global DTC Food Market, by Region, 2024 Vs. 2031 (USD Million)
Figure 18 North America: DTC Food Market Snapshot (2024)
Figure 19 Europe: DTC Food Market Snapshot (2024)
Figure 20 Asia-Pacific: DTC Food Market Snapshot (2024)
Figure 21 Latin America: DTC Food Market Snapshot (2024)
Figure 22 Middle East & Africa: DTC Food Market Snapshot (2024)
Figure 23 Key Growth Strategies Adopted by Leading Players (2020–2023)
Figure 24 Global DTC Food Market Competitive Benchmarking, by Type
Figure 25 Competitive Dashboard: DTC Food Market
Figure 26 Anheuser–Busch InBev NV/SA: Financial Overview (2022)
Figure 27 JBS S.A.: Financial Overview (2022)
Figure 28 Mondelēz International, Inc.: Financial Overview (2022)
Figure 29 Nestlé S.A.: Financial Overview (2022)
Figure 30 PepsiCo, Inc.: Financial Overview (2022)
Figure 31 The Coca-Cola Company: Financial Overview (2022)
Figure 32 The Kraft Heinz Company: Financial Overview (2022)
Figure 33 Unilever PLC: Financial Overview (2022)
Published Date: Oct-2024
Published Date: Sep-2024
Published Date: Jun-2024
Published Date: Mar-2024
Please enter your corporate email id here to view sample report.
Subscribe to get the latest industry updates