Resources
About Us
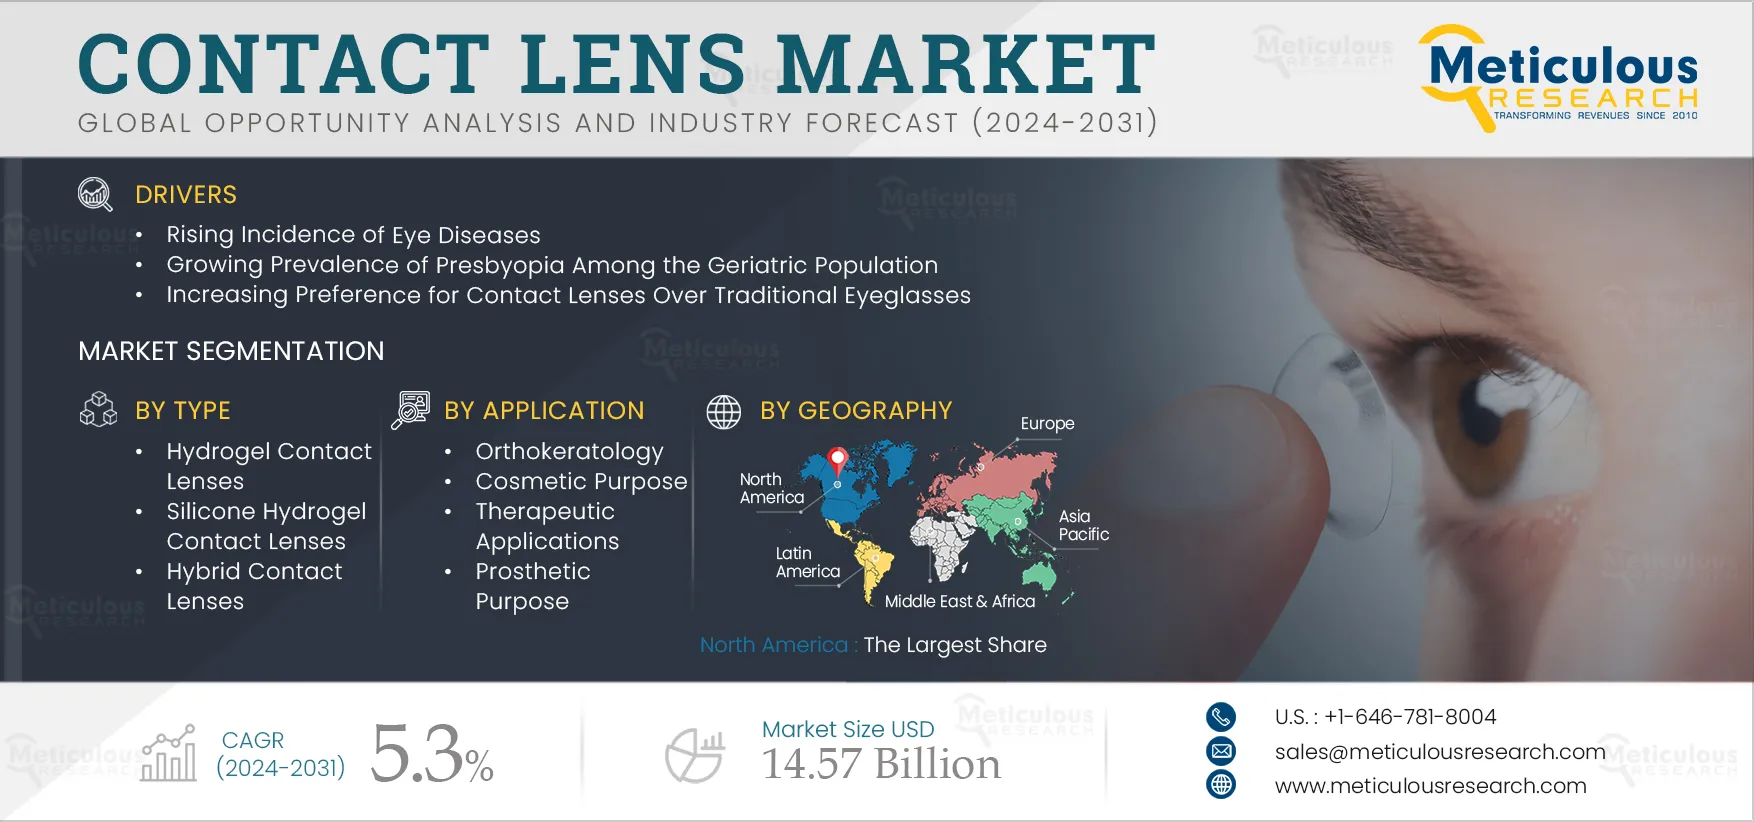
The growth of this market is driven by the rising incidence of eye diseases, a growing prevalence of presbyopia among the geriatric population, the increasing preference for contact lenses over traditional eyeglasses, and the rising utilization of contact lenses for aesthetic purposes. Furthermore, the rising awareness regarding contact lens usage, advancements in contact lens materials, and technological innovations are expected to create market growth opportunities.
As the prevalence of eye problems like astigmatism, hyperopia, presbyopia, corneal ectasias, and post-refractive surgeries continues to rise, there is a growing demand for vision correction solutions such as contact lenses. Contact lenses offer valuable and effective treatment options for many individuals with these conditions, thus fueling their demand.
Moreover, according to the World Health Organization (WHO) 2023 data, approximately 2.2 billion people globally have distance vision impairment. Additionally, 826 million people suffered from presbyopia, and 88.4 million suffered from a refractive error worldwide. The increasing incidence of eye diseases drives the demand for contact lenses.
 Click here to: Get Free Sample Pages of this Report
Contact lenses offer a broader range of vision correction options compared to eyeglasses, catering to various refractive issues such as hyperopia, myopia, presbyopia, and astigmatism. Special contact lenses like multifocal lenses for presbyopia and toric lenses for astigmatism provide tailored solutions for specific vision problems. This versatility makes contact lenses an attractive choice for individuals seeking precise and customized vision correction.
Additionally, contact lenses offer user-friendly convenience and enhanced mobility compared to eyeglasses. Unlike glasses, wearers can engage in various activities without worrying about their lenses slipping off or becoming damaged. This advantage makes contact lenses popular among sports enthusiasts and individuals in professions that demand unimpeded vision without the need for glasses.
Many individuals are increasingly becoming aware of the use of contact lenses as an alternative to traditional eyeglasses for vision correction. Furthermore, various organizations have initiated awareness programs to create awareness among people. For instance:
In August 2023, the Contact Lens Institute (CLI) (U.S.) introduced the 'EASY' awareness program, aiming to educate patients about contact lens cleaning, wear, and care advice.
Therefore, the rising public awareness about contact lenses is anticipated to create opportunities for the growth of the contact lens market.
Contact lens materials have undergone significant improvements to enhance comfort for consumers. Traditional contact lenses were often associated with discomfort, including pain, dryness, and irritation. However, modern materials such as polymethyl methacrylate, silicone hydrogels, and hydrogel offer increased oxygen permeability and wettability, allowing more oxygen to reach the cornea. This improved oxygenation reduces dryness and fosters better eye health, resulting in enhanced comfort throughout the day.
Furthermore, advancements in contact lens materials have facilitated the development of lenses suitable for prolonged wear, including overnight wear. These extended-wear contact lenses allow patients to wear them continuously for several days without the need for nightly removal. This option is convenient for individuals who prefer not to manage their lenses daily and offers flexibility for those with busy schedules.
Smart contact lenses represent a groundbreaking advancement in contact lens technology. These lenses integrate microelectronics and sensors to monitor various aspects of eye health. They can measure glucose levels in tears, which is particularly relevant for diabetic individuals, as well as monitor intraocular pressure, tear fluid composition, and early indicators of eye disorders. By providing continuous monitoring, smart contact lenses empower both doctors and consumers to proactively manage eye health.
Moreover, according to research from Nanyang Technological University (NTU) (Singapore) in August 2023, a breakthrough was achieved with the development of an ultra-thin battery, measuring only a few micrometers in size, capable of powering smart contact lenses and harnessing tear fluid for recharging. Furthermore, smart contact lenses can potentially offer vision improvements beyond standard correction methods. They can potentially enable clear vision at multiple distances without the need for multifocal lenses and can enhance contrast sensitivity while addressing color blindness in individuals with vision impairments.
Based on type, the contact lens market is segmented into hydrogel contact lenses, silicone hydrogel contact lenses, Rigid Gas Permeable (RGP) contact lenses, hybrid contact lenses, Polymethyl Methacrylate (PMMA) contact lenses, and accessories. In 2024, the silicone hydrogel contact lenses segment is expected to account for the largest share of 64.3% of the contact lens market. This segment's large market share can be attributed to the numerous benefits provided by silicone hydrogel lenses. These lenses allow more oxygen to reach the cornea compared to conventional hydrogel lenses, thereby reducing symptoms such as dryness, redness, impaired vision, and discomfort. Additionally, market players are actively introducing innovative products to meet the increasing demand for contact lenses. For instance, in September 2023, Vision Path, Inc. (U.S.) launched SkyHy by Hubble, a line of silicone hydrogel daily contact lenses. These lenses offer high oxygen permeability and comfort.
Moreover, the hydrogel contact lenses segment is projected to register the highest growth rate of 6.2% during the forecast period 2024–2031. This growth can be attributed to the rising demand for hydrogel contact lenses among consumers, driven by advancements in contact lens materials.
Based on design, the contact lens market is segmented into spherical, toric, bifocal, multifocal, and monovision. In 2024, the spherical segment is expected to account for the largest share of the contact lens market. Spherical contact lenses are comfortable to wear, widely available, and can move around the cornea without negatively affecting vision, which contributes to the large market share of this segment.
Based on usage, the contact lens market is segmented into daily wear contact lenses, daily disposable contact lenses, monthly replacement contact lenses, extended wear contact lenses, traditional contact lenses, and cosmetic contact lenses. In 2024, the daily wear contact lenses segment is expected to account for the largest share of the contact lens market. This segment's large market share can be attributed to the increasing consumer demand for daily wear lenses, driven by their convenience, growing awareness of eye health, and rising disposable incomes. Additionally, market players are actively seeking approvals from regulatory bodies to meet the rising demand for daily wear contact lenses. For instance, in June 2022, Johnson & Johnson Vision Care, Inc. (U.S.) received clearance from the U.S. Food & Drug Administration (FDA), approval from Health Canada, and completed CE Mark activities for ACUVUE OASYS MAX 1-Day and ACUVUE OASYS MAX 1-Day MULTIFOCAL daily wear contact lenses. These lenses offer exceptional visual clarity and all-day comfort.
Based on application, the contact lens market is segmented into orthokeratology, cosmetic purpose, therapeutic applications, prosthetic purpose, and other applications. In 2024, the orthokeratology segment is expected to account for the largest share of the contact lens market. This segment's large market share can be attributed to advancements in ortho-k contact lenses, facilitating improved stability and centration compared to corneal lenses. Moreover, market players are actively seeking approvals to meet the increasing demand for ortho-k contact lenses. For instance, in May 2021, Johnson & Johnson Vision Care, Inc. (U.S.) obtained approval from the U.S. Food and Drug Administration (FDA) for ACUVUE Abiliti overnight therapeutic lenses for myopia management.
Based on color variation, the contact lens market is segmented into opaque color contact lenses, enhancers/tinted contact lenses, and visibility tint contact lenses. In 2024, the opaque color contact lenses segment is expected to account for the largest share of the contact lens market. These contact lenses are typically available in solid colors and block patterns, offering a natural-looking enhancement to eye color. Additionally, opaque contact lenses help provide a natural appearance while preserving the original color of the eye. These factors contribute to the significant market share of this segment.
Based on distribution channel, the contact lens market is segmented into hospitals & clinics, retail stores, and E-commerce. In 2024, the hospitals & clinics segment is expected to account for the largest share of 52.0% of the contact lens market. This segment's large market share can be attributed to the high influx of patients in hospitals & clinics due to the presence of highly skilled healthcare professionals and advanced infrastructure, the significant demand for contact lenses from the pharmacies within these hospitals & clinics, and the proliferation of hospitals & clinics.
In 2024, North America is expected to account for the largest share of 34.5% of the contact lens market, followed by Europe and Asia-Pacific. North America's significant market share can be attributed to several factors, including the presence of major contact lens companies such as Johnson & Johnson Services, Inc (U.S.), a well-established healthcare infrastructure, and the increasing prevalence of eye diseases such as astigmatism, hyperopia, presbyopia, corneal ectasias, and post-refractive surgeries in this region.
However, the market in Asia-Pacific is projected to register the highest growth rate of 6.4% during the forecast period. The growth of this regional market is driven by the rising awareness about eye care and contact lenses, improving healthcare systems in countries such as China and India, increasing healthcare expenditures, and the growing awareness about contact lenses.
The report offers a competitive analysis based on an extensive assessment of the leading players' product portfolios and geographic presence and the key growth strategies adopted by them over the past 3–4 years. Some of the key players operating in the contact lens market are Johnson & Johnson Vision Care, Inc. (U.S.), Alcon Inc. (Switzerland), CooperVision, Inc. (U.S.), Bausch + Lomb Corporation (Canada), Carl Zeiss AG (Germany), HOYA Corporation (Japan), Essilor International SA (France), Menicon Co., Ltd. (Japan), UltraVision CLPL (U.K.), STAAR SURGICAL (U.S.), BenQ Materials Corporation (Taiwan), Visioneering Technologies, Inc. (U.S.), Excellent Hi-Care Pvt Ltd (India), and SEED Co., Ltd. (Japan).
In October 2023, Alcon Inc. (Switzerland) launched the TOTAL30 Multifocal, the only monthly Water Gradient multifocal contact lens for Patients with Presbyopia.
In June 2023, Bausch + Lomb Corporation (Canada) launched the INFUSE Multifocal silicone hydrogel (SiHy) daily disposable contact lenses in the U.S.
|
Particulars |
Details |
|
Number of Pages |
~270 |
|
Format |
|
|
Forecast Period |
2024–2031 |
|
Base Year |
2023 |
|
CAGR (Value) |
5.3% |
|
Market Size (Value) |
USD 14.57 Billion by 2031 |
|
Segments Covered |
By Type
By Design
By Usage
By Application
By Color Variation
By Distribution Channel
|
|
Countries Covered |
North America (U.S., Canada), Europe (Germany, France, Italy, U.K., Spain, Switzerland, Rest of Europe), Asia-Pacific (India, China, Japan, Australia, South Korea, Rest of Asia-Pacific), Latin America (Brazil, Mexico, Rest of Latin America), and the Middle East & Africa |
|
Key Companies Profiled |
Johnson & Johnson Vision Care, Inc. (U.S.), Alcon Inc. (Switzerland), CooperVision, Inc. (U.S.), Bausch + Lomb Corporation (Canada), Carl Zeiss AG (Germany), HOYA Corporation (Japan), Essilor International SA (France), Menicon Co., Ltd. (Japan), UltraVision CLPL (U.K.), STAAR SURGICAL (U.S.), BenQ Materials Corporation (Taiwan), Visioneering Technologies, Inc. (U.S.), Excellent Hi-Care Pvt Ltd (India), and SEED Co., Ltd. (Japan). |
This study offers a detailed assessment of the contact lens market and analyzes the market sizes & forecasts based on type, design, usage, application, color variation, and distribution channel. This report also provides value analyses of various segments and subsegments of the contact lens market at the regional and country levels.
The contact lens market is projected to reach $14.57 billion by 2031, at a CAGR of 5.3% during the forecast period.
Among all types covered in this report, in 2024, the hydrogel contact lenses segment is expected to account for the largest share of the market. This segment's large market share can be attributed to the numerous benefits provided by silicone hydrogel lenses. These lenses allow more oxygen to reach the cornea compared to conventional hydrogel lenses, thereby reducing symptoms such as dryness, redness, impaired vision, and discomfort.
Among all designs covered in this report, in 2024, the spherical segment is expected to account for the largest share of the contact lens market. The large market share of this segment can be attributed to the increasing demand for spherical contact lenses due to their comfortable wear, wide availability, and ability to move around the cornea without negatively affecting vision.
The growth of this market is driven by the rising incidence of eye diseases, a growing prevalence of presbyopia among the geriatric population, the increasing preference for contact lenses over traditional eyeglasses, and the rising utilization of contact lenses for aesthetic purposes.
Furthermore, the rising awareness regarding contact lens usage, advancements in contact lens materials, and technological innovations are expected to create market growth opportunities.
The key players profiled in the contact lens market report are Johnson & Johnson Vision Care, Inc. (U.S.), Alcon Inc. (Switzerland), CooperVision, Inc. (U.S.), Bausch + Lomb Corporation (Canada), Carl Zeiss AG (Germany), HOYA Corporation (Japan), Essilor International SA (France), Menicon Co., Ltd. (Japan), UltraVision CLPL (U.K.), STAAR SURGICAL (U.S.), BenQ Materials Corporation (Taiwan), Visioneering Technologies, Inc. (U.S.), Excellent Hi-Care Pvt Ltd (India), and SEED Co., Ltd. (Japan).
Emerging economies like China and India are expected to offer substantial growth opportunities for market players due to several factors, including the expansion of healthcare infrastructure, increased investments in advanced contact lens materials, and the rising awareness of contact lenses in these countries.
1. Introduction
1.1. Market Definition & Scope
1.2. Market Ecosystem
1.3. Currency and Limitations
1.4. Key Stakeholders
2. Research Methodology
2.1. Research Approach
2.2. Process of Data Collection & Validation
2.2.1. Secondary Research
2.2.2. Primary Research/Interviews with Key Opinion Leaders from the Industry
2.3. Market Sizing and Forecasting
2.3.1. Market Size Estimation Approach
2.3.2. Growth Forecast Approach
2.3.3. Market Share Analysis
2.4. Assumptions for the Study
3. Executive Summary
4. Factors Affecting Market Growth
4.1. Overview
4.2. Drivers
4.2.1. Rising Incidence of Eye Diseases
4.2.2. Growing Prevalence of Presbyopia Among the Geriatric Population
4.2.3. Increasing Preference for Contact Lenses Over Traditional Eyeglasses
4.2.4 Rising Utilization of Contact Lenses for Aesthetic Purposes
4.3. Restraints
4.3.1. Complications Associated with Prolonged Contact Lens Wear
4.3.2. Issues with Adaptation
4.3.3. Limited Pool of Potential Customers
4.4. Opportunities
4.4.1. Rising Awareness Regarding Contact Lens Usage
4.4.2. Advancements in Contact Lens Materials
4.4.3. Technological Advancements
4.5. Challenges
4.5.1. Availability of Alternative Vision Correction Methods
4.5.2. Need to Ensure the Proper Handling of Contact Lenses
4.6. Trends
4.6.1. Smart Contact Lenses
4.6.2. Drug-releasing Contact Lenses
4.7. Factor Analysis
4.8. Regulatory Analysis
4.8.1. U.S.
4.8.2. Canada
4.8.3. Europe
4.8.4 China
4.8.5. Japan
4.8.6. India
4.8.7. Latin America
4.8.8. Middle East
4.9. Pricing Analysis
4.10. Case Studies
4.11. Porter’s Five Forces Analysis
5. Contact Lens Market Assessment—by Type
5.1. Overview
5.2. Hydrogel Contact Lenses
5.3. Silicone Hydrogel Contact Lenses
5.4. Rigid Gas Permeable (RGP) Contact Lenses
5.5. Hybrid Contact Lenses
5.6. Polymethyl Methacrylate (PMMA) Contact Lenses
5.7. Contact Lens Accessories
6. Contact Lens Market Assessment—by Design
6.1. Overview
6.2. Spherical
6.3. Toric
6.4. Bifocal and Multifocal
6.5. Monovision
7. Contact Lens Market Assessment—by Usage
7.1. Overview
7.2. Daily Wear Contact Lenses
7.3. Daily Disposable Contact Lenses
7.4. Monthly Replacement Contact Lenses
7.5. Extended Wear Contact Lenses
7.6. Traditional Contact Lenses
7.7. Cosmetic Contact Lenses
8. Contact Lens Market Assessment—by Application
8.1. Overview
8.2. Orthokeratology
8.3. Cosmetic Purpose
8.4. Therapeutic Applications
8.5. Prosthetic Purpose
8.6. Other Applications
9. Contact Lens Market Assessment—by Color Variation
9.1. Overview
9.2. Opaque Color Contact Lenses
9.3. Enhancers/Tinted Contact Lenses
9.4. Visibility Tint Contact Lenses
10. Contact Lens Market Assessment—by Distribution Channel
10.1. Overview
10.2. Hospitals & Clinics
10.3. Retail Stores
10.4. E-commerce
11. Contact Lens Market Assessment—by Geography
11.1. Overview
11.2. North America
11.2.1. U.S.
11.2.2. Canada
11.3. Europe
11.3.1. Germany
11.3.2. France
11.3.3. U.K.
11.3.4. Italy
11.3.5. Spain
11.3.6. Switzerland
11.3.7. Rest of Europe
11.4. Asia-Pacific
11.4.1. Japan
11.4.2. China
11.4.4. Australia
11.4.5. South Korea
11.4.6. Rest of Asia-Pacific
11.5. Latin America
11.5.1. Brazil
11.5.2. Mexico
11.5.3. Rest of Latin America
11.6. Middle East & Africa
12. Competition Analysis
12.1. Overview
12.2. Key Growth Strategies
12.3. Competitive Benchmarking
12.4. Competitive Dashboard
12.4.1. Industry Leaders
12.4.2. Market Differentiators
12.4.3. Vanguards
12.4.4. Emerging Companies
12.5. Market Share Analysis, by Key Players (2023)
13. Company Profiles (Business Overview, Financial Overview, Product Portfolio, Strategic Developments, and SWOT Analysis*)
13.1. Alcon Inc.
13.2. Johnson & Johnson Vision Care, Inc.
13.3. CooperVision, Inc.
13.4. Bausch + Lomb Corporation
13.5. Carl Zeiss AG
13.6. HOYA Corporation
13.7. Essilor International SA
13.8. Menicon Co., Ltd.
13.9. UltraVision CLPL
13.10. STAAR SURGICAL
13.11. BenQ Materials Corporation
13.12. Visioneering Technologies, Inc.
13.13. Excellent Hi-Care Pvt Ltd
13.14. SEED Co., Ltd.
(Note: SWOT analyses of the top 5 companies will be provided.)
14. Appendix
14.1. Available Customization
14.2. Related Reports
List of Tables
Table 1 Global Contact Lens Market, by Type, 2022–2031 (USD Million)
Table 2 Global Hydrogel Contact Lenses Market, by Country/Region, 2022–2031 (USD Million)
Table 3 Global Silicone Hydrogel Contact Lenses Market, by Country/Region, 2022–2031 (USD Million)
Table 4 Global Rigid Gas Permeable (RGP) Contact Lenses Market, by Country/Region, 2022–2031 (USD Million)
Table 5 Global Hybrid Contact Lenses Market, by Country/Region, 2022–2031 (USD Million)
Table 6 Global Polymethyl Methacrylate (PMMA) Contact Lenses Market, by Country/Region, 2022–2031 (USD Million)
Table 7 Global Contact Lenses Accessories Market, by Country/Region, 2022–2031 (USD Million)
Table 8 Global Contact Lens Market, by Design, 2022–2031 (USD Million)
Table 9 Global Spherical Contact Lenses Market, by Country/Region, 2022–2031 (USD Million)
Table 10 Global Toric Contact Lenses Market, by Country/Region, 2022–2031 (USD Million)
Table 11 Global Bifocal and Multifocal Contact Lenses Market, by Country/Region, 2022–2031 (USD Million)
Table 12 Global Monovision Contact Lenses Market, by Country/Region, 2022–2031 (USD Million)
Table 13 Global Contact Lens Market, by Usage, 2022–2031 (USD Million)
Table 14 Global Daily Wear Contact Lenses Market, by Country/Region, 2022–2031 (USD Million)
Table 15 Global Daily Disposable Contact Lenses Market, by Country/Region, 2022–2031 (USD Million)
Table 16 Global Monthly Replacement Contact Lenses Market, by Country/Region, 2022–2031 (USD Million)
Table 17 Global Extended Wear Contact Lenses Market, by Country/Region, 2022–2031 (USD Million)
Table 18 Global Traditional Contact Lenses Market, by Country/Region, 2022–2031 (USD Million)
Table 19 Global Cosmetic Contact Lenses Market, by Country/Region, 2022–2031 (USD Million)
Table 20 Global Contact Lens Market, by Application, 2022–2031 (USD Million)
Table 21 Global Contact Lens Market for Orthokeratology , by Country/Region, 2022–2031 (USD Million)
Table 22 Global Contact Lens Market for Cosmetic Purpose, by Country/Region, 2022–2031 (USD Million)
Table 23 Global Contact Lens Market for Therapeutic Applications, by Country/Region, 2022–2031 (USD Million)
Table 24 Global Contact Lens Market for Prosthetic Purpose, by Country/Region, 2022–2031 (USD Million)
Table 25 Global Contact Lens Market for Other Application, by Country/Region, 2022–2031 (USD Million)
Table 26 Global Contact Lens Market, by Color Variation, 2022–2031 (USD Million)
Table 27 Global Opaque Color Contact Lenses Market, by Country/Region, 2022–2031 (USD Million)
Table 28 Global Enhancers/Tinted Contact Lenses Market, by Country/Region, 2022–2031 (USD Million)
Table 29 Global Visibility Tint Contact Lenses Market, by Country/Region, 2022–2031 (USD Million)
Table 30 Global Contact Lens Market, by Distribution Channel, 2022–2031 (USD Million)
Table 31 Global Contact Lens Market for Hospitals & Clinics, by Country/Region, 2022–2031 (USD Million)
Table 32 Global Contact Lens Market for Retail Stores, by Country/Region, 2022–2031 (USD Million)
Table 33 Global Contact Lens Market for E-commerce, by Country/Region, 2022–2031 (USD Million)
Table 34 Global Contact Lens Market, by Country/Region, 2022–2031 (USD Million)
Table 35 North America: Contact Lens Market, by Country, 2022–2031 (USD Million)
Table 36 North America: Contact Lens Market, by Type, 2022–2031 (USD Million)
Table 37 North America: Contact Lens Market, by Design, 2022–2031 (USD Million)
Table 38 North America: Contact Lens Market, by Usage, 2022–2031 (USD Million)
Table 39 North America: Contact Lens Market, by Application, 2022–2031 (USD Million)
Table 40 North America: Contact Lens Market, by Color Variation, 2022–2031 (USD Million)
Table 41 North America: Contact Lens Market, by Distribution Channel, 2022–2031 (USD Million)
Table 42 U.S.: Contact Lens Market, by Type, 2022–2031 (USD Million)
Table 43 U.S.: Contact Lens Market, by Design, 2022–2031 (USD Million)
Table 44 U.S.: Contact Lens Market, by Usage, 2022–2031 (USD Million)
Table 45 U.S.: Contact Lens Market, by Application, 2022–2031 (USD Million)
Table 46 U.S.: Contact Lens Market, by Color Variation, 2022–2031 (USD Million)
Table 47 U.S.: Contact Lens Market, by Distribution Channel, 2022–2031 (USD Million)
Table 48 Canada: Contact Lens Market, by Type, 2022–2031 (USD Million)
Table 49 Canada: Contact Lens Market, by Design, 2022–2031 (USD Million)
Table 50 Canada: Contact Lens Market, by Usage, 2022–2031 (USD Million)
Table 51 Canada: Contact Lens Market, by Application, 2022–2031 (USD Million)
Table 52 Canada: Contact Lens Market, by Color Variation, 2022–2031 (USD Million)
Table 53 Canada: Contact Lens Market, by Distribution Channel, 2022–2031 (USD Million)
Table 54 Europe: Contact Lens Market, by Country/Region, 2022–2031 (USD Million)
Table 55 Europe: Contact Lens Market, by Type, 2022–2031 (USD Million)
Table 56 Europe: Contact Lens Market, by Design, 2022–2031 (USD Million)
Table 57 Europe: Contact Lens Market, by Usage, 2022–2031 (USD Million)
Table 58 Europe: Contact Lens Market, by Application, 2022–2031 (USD Million)
Table 59 Europe: Contact Lens Market, by Color Variation, 2022–2031 (USD Million)
Table 60 Europe: Contact Lens Market, by Distribution Channel, 2022–2031 (USD Million)
Table 61 Germany: Contact Lens Market, by Type, 2022–2031 (USD Million)
Table 62 Germany: Contact Lens Market, by Design, 2022–2031 (USD Million)
Table 63 Germany: Contact Lens Market, by Usage, 2022–2031 (USD Million)
Table 64 Germany: Contact Lens Market, by Application, 2022–2031 (USD Million)
Table 65 Germany: Contact Lens Market, by Color Variation, 2022–2031 (USD Million)
Table 66 Germany: Contact Lens Market, by Distribution Channel, 2022–2031 (USD Million)
Table 67 France: Contact Lens Market, by Type, 2022–2031 (USD Million)
Table 68 France: Contact Lens Market, by Design, 2022–2031 (USD Million)
Table 69 France: Contact Lens Market, by Usage, 2022–2031 (USD Million)
Table 70 France: Contact Lens Market, by Application, 2022–2031 (USD Million)
Table 71 France: Contact Lens Market, by Color Variation, 2022–2031 (USD Million)
Table 72 France: Contact Lens Market, by Distribution Channel, 2022–2031 (USD Million)
Table 73 Italy: Contact Lens Market, by Type, 2022–2031 (USD Million)
Table 74 Italy: Contact Lens Market, by Design, 2022–2031 (USD Million)
Table 75 Italy: Contact Lens Market, by Usage, 2022–2031 (USD Million)
Table 76 Italy: Contact Lens Market, by Application, 2022–2031 (USD Million)
Table 77 Italy: Contact Lens Market, by Color Variation, 2022–2031 (USD Million)
Table 78 Italy: Contact Lens Market, by Distribution Channel, 2022–2031 (USD Million)
Table 79 Spain: Contact Lens Market, by Type, 2022–2031 (USD Million)
Table 80 Spain: Contact Lens Market, by Design, 2022–2031 (USD Million)
Table 81 Spain: Contact Lens Market, by Usage, 2022–2031 (USD Million)
Table 82 Spain: Contact Lens Market, by Application, 2022–2031 (USD Million)
Table 83 Spain: Contact Lens Market, by Color Variation, 2022–2031 (USD Million)
Table 84 Spain: Contact Lens Market, by Distribution Channel, 2022–2031 (USD Million)
Table 85 U.K.: Contact Lens Market, by Type, 2022–2031 (USD Million)
Table 86 U.K.: Contact Lens Market, by Design, 2022–2031 (USD Million)
Table 87 U.K.: Contact Lens Market, by Usage, 2022–2031 (USD Million)
Table 88 U.K.: Contact Lens Market, by Application, 2022–2031 (USD Million)
Table 89 U.K.: Contact Lens Market, by Color Variation, 2022–2031 (USD Million)
Table 90 U.K.: Contact Lens Market, by Distribution Channel, 2022–2031 (USD Million)
Table 91 Switzerland: Contact Lens Market, by Type, 2022–2031 (USD Million)
Table 92 Switzerland: Contact Lens Market, by Design, 2022–2031 (USD Million)
Table 93 Switzerland: Contact Lens Market, by Usage, 2022–2031 (USD Million)
Table 94 Switzerland: Contact Lens Market, by Application, 2022–2031 (USD Million)
Table 95 Switzerland: Contact Lens Market, by Color Variation, 2022–2031 (USD Million)
Table 96 Switzerland: Contact Lens Market, by Distribution Channel, 2022–2031 (USD Million)
Table 97 Rest of Europe: Contact Lens Market, by Type, 2022–2031 (USD Million)
Table 98 Rest of Europe: Contact Lens Market, by Design, 2022–2031 (USD Million)
Table 99 Rest of Europe: Contact Lens Market, by Usage, 2022–2031 (USD Million)
Table 100 Rest of Europe: Contact Lens Market, by Application, 2022–2031 (USD Million)
Table 101 Rest of Europe: Contact Lens Market, by Color Variation, 2022–2031 (USD Million)
Table 102 Rest of Europe: Contact Lens Market, by Distribution Channel, 2022–2031 (USD Million)
Table 103 Asia-Pacific: Contact Lens Market, by Country/Region, 2022–2031 (USD Million)
Table 104 Asia-Pacific: Contact Lens Market, by Type, 2022–2031 (USD Million)
Table 105 Asia-Pacific: Contact Lens Market, by Design, 2022–2031 (USD Million)
Table 106 Asia-Pacific: Contact Lens Market, by Usage, 2022–2031 (USD Million)
Table 107 Asia-Pacific: Contact Lens Market, by Application, 2022–2031 (USD Million)
Table 108 Asia-Pacific: Contact Lens Market, by Color Variation, 2022–2031 (USD Million)
Table 109 Asia-Pacific: Contact Lens Market, by Distribution Channel, 2022–2031 (USD Million)
Table 110 Japan: Contact Lens Market, by Type, 2022–2031 (USD Million)
Table 111 Japan: Contact Lens Market, by Design, 2022–2031 (USD Million)
Table 112 Japan: Contact Lens Market, by Usage, 2022–2031 (USD Million)
Table 113 Japan: Contact Lens Market, by Application, 2022–2031 (USD Million)
Table 114 Japan: Contact Lens Market, by Color Variation, 2022–2031 (USD Million)
Table 115 Japan: Contact Lens Market, by Distribution Channel, 2022–2031 (USD Million)
Table 116 China: Contact Lens Market, by Type, 2022–2031 (USD Million)
Table 117 China: Contact Lens Market, by Design, 2022–2031 (USD Million)
Table 118 China: Contact Lens Market, by Usage, 2022–2031 (USD Million)
Table 119 China: Contact Lens Market, by Application, 2022–2031 (USD Million)
Table 120 China: Contact Lens Market, by Color Variation, 2022–2031 (USD Million)
Table 121 China: Contact Lens Market, by Distribution Channel, 2022–2031 (USD Million)
Table 122 India: Contact Lens Market, by Type, 2022–2031 (USD Million)
Table 123 India: Contact Lens Market, by Design, 2022–2031 (USD Million)
Table 124 India: Contact Lens Market, by Usage, 2022–2031 (USD Million)
Table 125 India: Contact Lens Market, by Application, 2022–2031 (USD Million)
Table 126 India: Contact Lens Market, by Color Variation, 2022–2031 (USD Million)
Table 127 India: Contact Lens Market, by Distribution Channel, 2022–2031 (USD Million)
Table 128 South Korea: Contact Lens Market, by Type, 2022–2031 (USD Million)
Table 129 South Korea: Contact Lens Market, by Design, 2022–2031 (USD Million)
Table 130 South Korea: Contact Lens Market, by Usage, 2022–2031 (USD Million)
Table 131 South Korea: Contact Lens Market, by Application, 2022–2031 (USD Million)
Table 132 South Korea: Contact Lens Market, by Color Variation, 2022–2031 (USD Million)
Table 133 South Korea: Contact Lens Market, by Distribution Channel, 2022–2031 (USD Million)
Table 134 Australia: Contact Lens Market, by Type, 2022–2031 (USD Million)
Table 135 Australia: Contact Lens Market, by Design, 2022–2031 (USD Million)
Table 136 Australia: Contact Lens Market, by Usage, 2022–2031 (USD Million)
Table 137 Australia: Contact Lens Market, by Application, 2022–2031 (USD Million)
Table 138 Australia: Contact Lens Market, by Color Variation, 2022–2031 (USD Million)
Table 139 Australia: Contact Lens Market, by Distribution Channel, 2022–2031 (USD Million)
Table 140 Rest of Asia-Pacific: Contact Lens Market, by Type, 2022–2031 (USD Million)
Table 141 Rest of Asia-Pacific: Contact Lens Market, by Design, 2022–2031 (USD Million)
Table 142 Rest of Asia-Pacific: Contact Lens Market, by Usage, 2022–2031 (USD Million)
Table 143 Rest of Asia-Pacific: Contact Lens Market, by Application, 2022–2031 (USD Million)
Table 144 Rest of Asia-Pacific: Contact Lens Market, by Color Variation, 2022–2031 (USD Million)
Table 145 Rest of Asia-Pacific: Contact Lens Market, by Distribution Channel, 2022–2031 (USD Million)
Table 146 Latin America: Contact Lens Market, by Country/Region, 2022–2031 (USD Million)
Table 147 Latin America: Contact Lens Market, by Type, 2022–2031 (USD Million)
Table 148 Latin America: Contact Lens Market, by Design, 2022–2031 (USD Million)
Table 149 Latin America: Contact Lens Market, by Usage, 2022–2031 (USD Million)
Table 150 Latin America: Contact Lens Market, by Application, 2022–2031 (USD Million)
Table 151 Latin America: Contact Lens Market, by Color Variation, 2022–2031 (USD Million)
Table 152 Latin America: Contact Lens Market, by Distribution Channel, 2022–2031 (USD Million)
Table 153 Brazil: Contact Lens Market, by Type, 2022–2031 (USD Million)
Table 154 Brazil: Contact Lens Market, by Design, 2022–2031 (USD Million)
Table 155 Brazil: Contact Lens Market, by Usage, 2022–2031 (USD Million)
Table 156 Brazil: Contact Lens Market, by Application, 2022–2031 (USD Million)
Table 157 Brazil: Contact Lens Market, by Color Variation, 2022–2031 (USD Million)
Table 158 Brazil: Contact Lens Market, by Distribution Channel, 2022–2031 (USD Million)
Table 159 Mexico: Contact Lens Market, by Type, 2022–2031 (USD Million)
Table 160 Mexico: Contact Lens Market, by Design, 2022–2031 (USD Million)
Table 161 Mexico: Contact Lens Market, by Usage, 2022–2031 (USD Million)
Table 162 Mexico: Contact Lens Market, by Application, 2022–2031 (USD Million)
Table 163 Mexico: Contact Lens Market, by Color Variation, 2022–2031 (USD Million)
Table 164 Mexico: Contact Lens Market, by Distribution Channel, 2022–2031 (USD Million)
Table 165 Rest of Latin America: Contact Lens Market, by Type, 2022–2031 (USD Million)
Table 166 Rest of Latin America: Contact Lens Market, by Design, 2022–2031 (USD Million)
Table 167 Rest of Latin America: Contact Lens Market, by Usage, 2022–2031 (USD Million)
Table 168 Rest of Latin America: Contact Lens Market, by Application, 2022–2031 (USD Million)
Table 169 Rest of Latin America: Contact Lens Market, by Color Variation, 2022–2031 (USD Million)
Table 170 Rest of Latin America: Contact Lens Market, by Distribution Channel, 2022–2031 (USD Million)
Table 171 Middle East & Africa: Contact Lens Market, by Type, 2022–2031 (USD Million)
Table 172 Middle East & Africa: Contact Lens Market, by Design, 2022–2031 (USD Million)
Table 173 Middle East & Africa: Contact Lens Market, by Usage, 2022–2031 (USD Million)
Table 174 Middle East & Africa: Contact Lens Market, by Application, 2022–2031 (USD Million)
Table 175 Middle East & Africa: Contact Lens Market, by Color Variation, 2022–2031 (USD Million)
Table 176 Middle East & Africa: Contact Lens Market, by Distribution Channel, 2022–2031 (USD Million)
Table 177 Recent Developments, by Company, 2020–2024
List of Figures
Figure 1 Research Process
Figure 2 Key Secondary Sources
Figure 3 Primary Research Techniques
Figure 4 Key Executives Interviewed
Figure 5 Breakdown of Primary Interviews (Supply-side & Demand-side)
Figure 6 Market Size Estimation
Figure 7 Global Contact Lens Market, by Type, 2024 Vs. 2031 (USD Million)
Figure 8 Global Contact Lens Market, by Design, 2024 Vs. 2031 (USD Million)
Figure 9 Global Contact Lens Market, by Usage, 2024 Vs. 2031 (USD Million)
Figure 10 Global Contact Lens Market, by Application, 2024 Vs. 2031 (USD Million)
Figure 11 Global Contact Lens Market, by Color Variation, 2024 Vs. 2031 (USD Million)
Figure 12 Global Contact Lens Market, by Distribution Channel, 2024 Vs. 2031 (USD Million)
Figure 13 Global Contact Lens Market, by Geography
Figure 14 Impact Analysis: Contact Lens Market
Figure 15 Global Contact Lens Market, by Type, 2024 Vs. 2031 (USD Million)
Figure 16 Global Contact Lens Market, by Design, 2024 Vs. 2031 (USD Million)
Figure 17 Global Contact Lens Market, by Usage, 2024 Vs. 2031 (USD Million)
Figure 18 Global Contact Lens Market, by Application, 2024 Vs. 2031 (USD Million)
Figure 19 Global Contact Lens Market, by Color Variation, 2024 Vs. 2031 (USD Million)
Figure 20 Global Contact Lens Market, by Distribution Channel, 2024 Vs. 2031 (USD Million)
Figure 21 Global Contact Lens Market, by Geography, 2024 Vs. 2031 (USD Million)
Figure 22 North America: Contact Lens Market Snapshot
Figure 23 Europe: Contact Lens Market Snapshot
Figure 24 Asia-Pacific: Contact Lens Market Snapshot
Figure 25 Latin America: Contact Lens Market Snapshot
Figure 26 Key Growth Strategies Adopted by Leading Players, 2020–2024
Figure 27 Global Contact Lens Market: Competitive Benchmarking, by Product
Figure 28 Global Contact Lens Market: Competitive Benchmarking, by Geography
Figure 29 Global Contact Lens Market: Competitive Dashboard
Figure 30 Market Share Analysis: Global Contact Lens Market, 2023
Figure 31 Alcon Inc.: Financial Overview (2023)
Figure 32 Johnson & Johnson Vision Care, Inc.: Financial Overview (2023)
Figure 33 CooperVision, Inc.: Financial Overview (2023)
Figure 34 Bausch + Lomb Corporation: Financial Overview (2023)
Figure 35 Carl Zeiss AG: Financial Overview (2023)
Figure 36 HOYA Corporation: Financial Overview (2023)
Figure 37 Menicon Co., Ltd.: Financial Overview (2023)
Figure 38 BenQ Materials Corporation: Financial Overview (2023)
Figure 39 Visioneering Technologies, Inc.: Financial Overview (2023)
Figure 40 SEED Co., Ltd.: Financial Overview (2023)


Published Date: Aug-2024
Published Date: Jun-2024
Published Date: May-2024
Subscribe to get the latest industry updates