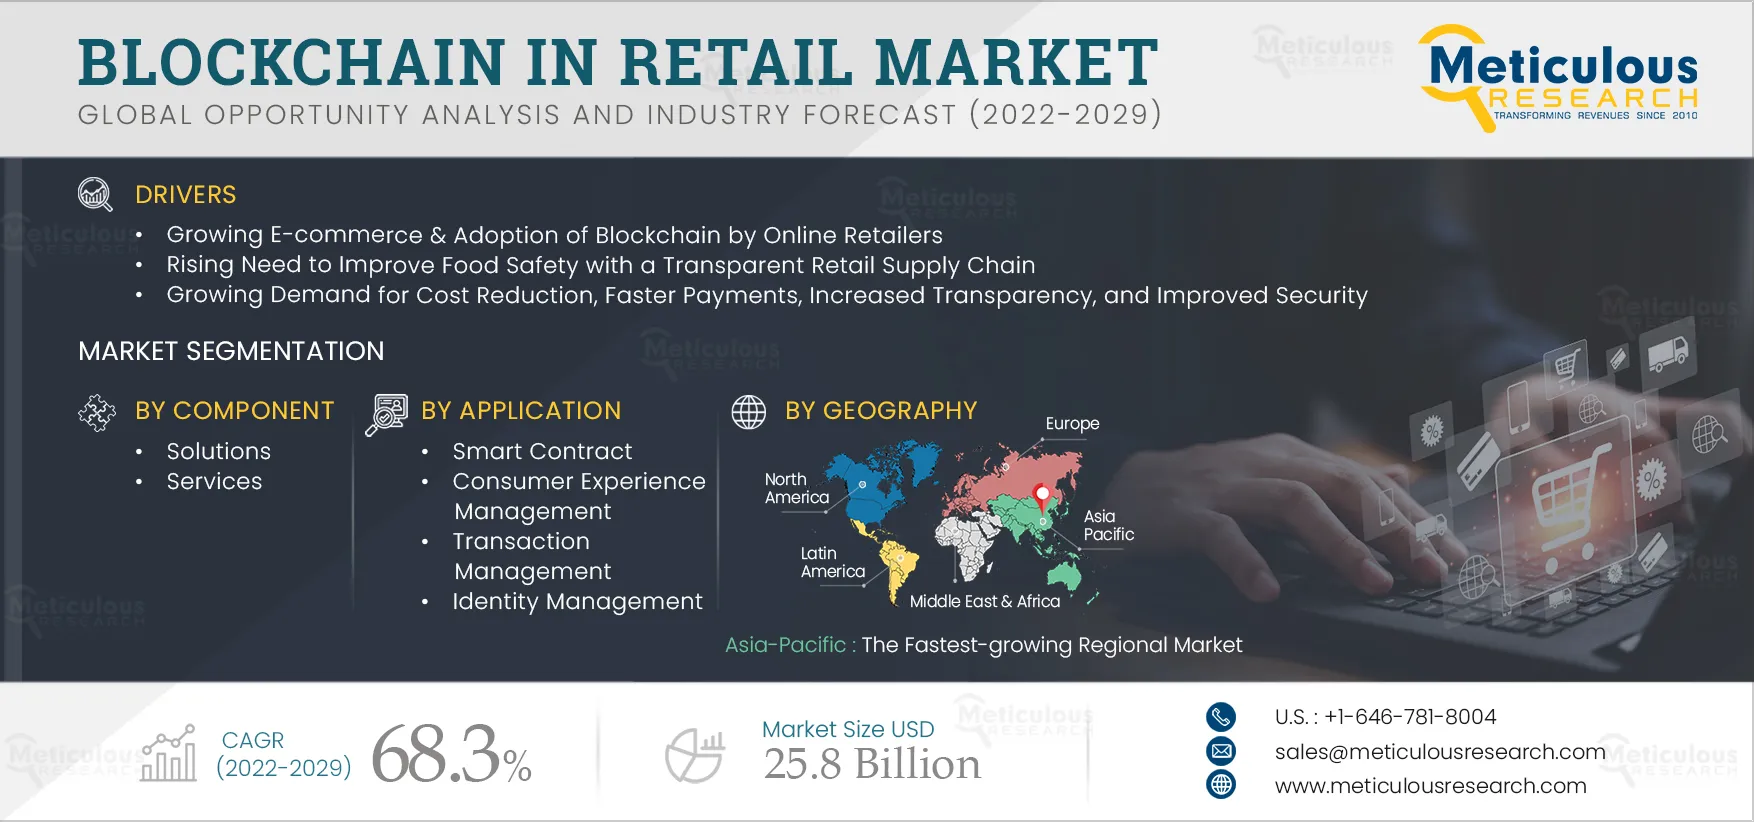
1. Introduction
1.1 Market Definition
1.2 Scope of the Study
1.3 Global Blockchain in Retail Market Ecosystem
1.4 Currency & Limitations
1.4.1 Currency
1.4.2 Limitations
1.5 Key Stakeholders
2. Research Methodology
2.1 Research Approach
2.2 Data Collection & Validation
2.2.1 Secondary Research
2.2.2 Primary Research
2.3 Market Assessment
2.3.1 Market Size Estimation
2.3.1.1 Bottom-up Approach
2.3.1.2 Top-down Approach
2.3.1.3 Growth Forecast
2.3.2 Market Share Analysis
2.4 Assumptions for the Study
3. Executive Summary
3.1. Market Analysis, by Component
3.2. Market Analysis, by Application
3.3. Market Analysis, by Organization Size
3.4. Market Analysis, by Provider
3.5. Market Analysis, by Deployment Mode
3.6. Market Analysis, by Type
3.7. Market Analysis, by Geography
4. Impact of COVID-19 on the Blockchain in Retail Market
5. Market Insights
5.1 Introduction
5.2 Market Dynamics
5.2.1 Drivers
5.2.1.1. Growing E-commerce & Adoption of Blockchain by Online Retailers
5.2.1.2 Rising Need to Improve Food Safety with a Transparent Retail Supply Chain
5.2.1.3. Growing Demand for Cost Reduction, Faster Payments, Increased Transparency, and Improved Security
5.2.2 Restraints
5.2.2.1. Lack of Technology Adoption by Unorganized Retail Sector
5.2.2.2. Dynamic Regulatory & Compliance Environment
5.2.3 Opportunities
5.2.3.1 Growing Adoption of Crypto Payment Services in the Retail Sector
5.2.3.2. Blockchain Contribution to B2B Payments
5.2.3.3. Increasing Proliferation of Blockchain to Fight Counterfeiting in the Retail Industry
5.2.4 Challenges
5.2.4.1. Growing Number of Digital Attacks
5.2.4.2. Lack of Awareness & Technical Understanding of Blockchain Technology
5.2.5 Trends
5.2.5.1. Surge in Demand For Blockchain-based Solutions For Faster and Contactless Payment Processing
5.2.5.2 Increasing demand for QR code or Near-field Communication Chip (NFC)-enabled Products in Retail Stores
5.3 Case Studies
5.3.1 Case Study - 1
5.3.2 Case Study - 2
5.3.3 Case Study - 3
5.3.4 Case Study - 4
5.3.5. Case Study - 5
5.4. Blockchain in Retail Market Ecosystem Analysis
6. Blockchain in Retail Market, by Component
6.1 Introduction
6.2 Solutions
6.3 Services
7. Blockchain in Retail Market, by Application
7.1 Introduction
7.2 Smart Contract
7.3 Consumer Experience Management
7.4 Transaction Management
7.5 Supply Chain Management
7.6 Compliance Management
7.7 Identity Management
7.8 Food Safety Management
7.9 Fraud Detection/Management
7.10 Other Applications
8. Blockchain in Retail Market, by Organization Size
8.1 Introduction
8.2 Large Enterprises
8.3 Small and Medium-sized Enterprises
9. Blockchain in Retail Market, by Provider
9.1 Introduction
9.2 Application Provider
9.3 Middleware Provider
9.4 Infrastructure Provider
10. Blockchain in Retail Market, by Type
10.1 Introduction
10.2 Public Blockchain
10.3 Permissioned or Private Blockchain
10.4 Federated or Consortium Blockchain
10.5 Hybrid Blockchain
11. Blockchain in Retail Market, by Deployment Mode
11.1 Introduction
11.2 On-premise Deployment
11.3 Cloud-based Deployment
12. Blockchain in Retail Market, by Geography
12.1 North America
12.1.1 U.S.
12.1.2 Canada
12.2 Europe
12.2.1 Germany
12.2.2 U.K.
12.2.3 France
12.2.4 Italy
12.2.5 Spain
12.2.6. Netherlands
12.2.7. Switzerland
12.2.8. Rest of Europe
12.3 Asia-Pacific
12.3.1. Japan
12.3.2. China
12.3.3. India
12.3.4. South Korea
12.3.5. Singapore
12.3.6. Rest of Asia-Pacific
12.4 Latin America
12.4.1. Mexico
12.4.2. Brazil
12.4.3. Rest of Latin America
12.5 Middle East & Africa
12.5.1. UAE
12.5.2. Israel
12.5.3. Rest of Middle East & Africa
13. Blockchain in Retail Market: Competitive Landscape
13.1 Introduction
13.2 Key Growth Strategies
13.2.1 Market Differentiators
13.2.2 Synergy Analysis: Major Deals & Strategic Alliance
13.3 Competitive Dashboard
13.3.1. Industry Leader
13.3.2. Market Differentiators
13.3.3. Vanguards
13.3.4. Contemporary Stalwarts
13.4 Vendor Market Positioning
13.5 Market Share Analysis
14. Company Profiles (Business Overview, Financial Overview, Product Portfolio, and Strategic Developments)
14.1 International Business Machines Corporation (U.S.)
14.2 SAP SE (Germany)
14.3 Microsoft Corporation (U.S.)
14.4 Oracle Corporation (U.S.)
14.5 Amazon Web Services, Inc. (U.S.)
14.6 Infosys Limited (India)
14.7 Cognizant Technology Solutions Corporation (U.S.)
14.8 Tata Consultancy Services Limited (India)
14.9 Coinbase, Inc. (U.S.)
14.10 Bitfury Holding B.V. (Netherlands)
14.11 Auxesis Services & Technologies (P) Ltd (India)
14.12 Reply (Italy)
14.13 Blockchain Foundry inc. (Canada)
14.14 Cisco Systems Inc. (U.S.)
14.15 BitPay Inc. (U.S.)
14.16 Abra (U.S.)
14.17 Project Provenance Ltd (U.K.)
14.18 BigchainDB GmbH (Germany)
15. Appendix
15.1 Questionnaire
15.2 Available Customization
List of Tables
Table 1 Global Blockchain in Retail Market Size, by Country/Region, 2020–2029(USD Million)
Table 2 Global Blockchain in Retail Market Size, by Component, 2020–2029 (USD Million)
Table 3 Global Blockchain in Retail Solutions Market Size, by Country/Region, 2020–2029 (USD Million)
Table 4 Global Blockchain in Retail Services Market Size, by Country/Region, 2020–2029 (USD Million)
Table 5 Global Blockchain in Retail Market Size, by Application, 2020–2029 (USD Million)
Table 6 Global Smart Contract Market Size, by Country/Region, 2020–2029 (USD Million)
Table 7 Global Consumer Experience Management Market Size, by Country/Region, 2020–2029 (USD Million)
Table 8 Global Transaction Management Market Size, by Country/Region, 2020–2029 (USD Million)
Table 9 Global Supply Chain Management Market Size, by Country/Region, 2020–2029 (USD Million)
Table 10 Global Compliance Management Market Size, by Country/Region, 2020–2029 (USD Million)
Table 11 Global Identity Management Market Size, by Country/Region, 2020–2029 (USD Million)
Table 12 Global Food Safety Management Market Size, by Country/Region, 2020–20212 (USD Million)
Table 13 Global Fraud Detection/Management Market Size, by Country/Region, 2020–2029 (USD Million)
Table 14 Global Other Applications Market Size, by Country/Region, 2020–2029 (USD Million)
Table 15 Global Blockchain in Retail Market Size, by Organization Size, 2020–2029 (USD Million)
Table 16 Global Blockchain in Retail Market Size for Large Enterprises, by Country/Region, 2020–20212 (USD Million)
Table 17 Global Blockchain in Retail Market Size for Small and Medium-sized Enterprises, by Country/Region, 2020–20212 (USD Million)
Table 18 Global Blockchain in Retail Market Size, by Provider, 2020–2029 (USD Million)
Table 19 Global Application Provider Market Size, by Country/Region, 2020–2029 (USD Million)
Table 20 Global Middleware Provider Market Size, by Country/Region, 2020–2029 (USD Million)
Table 21 Global Infrastructure Provider Market Size, by Country/Region, 2020–2029 (USD Million)
Table 22 Global Blockchain in Retail Market Size, by Type, 2020–20212 (USD Million)
Table 23 Global Public Blockchain Market Size, by Country/Region, 2020–2029 (USD Million)
Table 24 Global Permissioned or Private Blockchain Market Size, by Country/Region, 2020–2029 (USD Million)
Table 25 Global Federated or Consortium Blockchain Market Size, by Country/Region, 2020–2029 (USD Million)
Table 26 Global Hybrid Blockchain Market Size, by Country/Region, 2020–2029 (USD Million)
Table 27 Global Blockchain in Retail Market Size, by Deployment Mode, 2020–20212 (USD Million)
Table 28 Global On-premise Deployment Market Size, by Country/Region, 2020–2029 (USD Million)
Table 29 Global Cloud-based Deployment Market Size, by Country/Region, 2020–2029 (USD Million)
Table 30 Global Blockchain in Retail Market Size, by Country/Region, 2020–20212 (USD Million)
Table 31 North America: Blockchain in Retail Market Size, by Country, 2020–20212 (USD Million)
Table 32 North America: Blockchain in Retail Market Size, by Component, 2020–2029 (USD Million)
Table 33 North America: Blockchain in Retail Market Size, by Application, 2020–2029 (USD Million)
Table 34 North America: Blockchain in Retail Market Size, by Organization Size, 2020–2029 (USD Million)
Table 35 North America: Blockchain in Retail Market Size, by Provider, 2020–2029 (USD Million)
Table 36 North America: Blockchain in Retail Market Size, by Type, 2020–2029 (USD Million)
Table 37 North America: Blockchain in Retail Market Size, by Deployment Mode, 2020–2029 (USD Million)
Table 38 U.S.: Blockchain in Retail Market Size, by Component, 2020–2029 (USD Million)
Table 39 U.S.: Blockchain in Retail Market Size, by Application, 2020–2029 (USD Million)
Table 40 U.S.: Blockchain in Retail Market Size, by Organization Size, 2020–2029 (USD Million)
Table 41 U.S.: Blockchain in Retail Market Size, by Provider, 2020–2029 (USD Million)
Table 42 U.S.: Blockchain in Retail Market Size, by Type, 2020–2029 (USD Million)
Table 43 U.S.: Blockchain in Retail Market Size, by Deployment Mode, 2020–2029 (USD Million)
Table 44 Canada: Blockchain in Retail Market Size, by Component, 2020–2029 (USD Million)
Table 45 Canada: Blockchain in Retail Market Size, by Application, 2020–2029 (USD Million)
Table 46 Canada: Blockchain in Retail Market Size, by Organization Size, 2020–2029 (USD Million)
Table 47 Canada: Blockchain in Retail Market Size, by Provider, 2020–2029 (USD Million)
Table 48 Canada: Blockchain in Retail Market Size, by Type, 2020–2029 (USD Million)
Table 49 Canada: Blockchain in Retail Market Size, by Deployment Mode, 2020–2029 (USD Million)
Table 50 Europe: Blockchain in Retail Market Size, by Country/Region, 2020–20212 (USD Million)
Table 51 Europe: Blockchain in Retail Market Size, by Component, 2020–2029 (USD Million)
Table 52 Europe: Blockchain in Retail Market Size, by Application, 2020–2029 (USD Million)
Table 53 Europe: Blockchain in Retail Market Size, by Organization Size, 2020–2029 (USD Million)
Table 54 Europe: Blockchain in Retail Market Size, by Provider, 2020–2029 (USD Million)
Table 55 Europe: Blockchain in Retail Market Size, by Type, 2020–2029 (USD Million)
Table 56 Europe: Blockchain in Retail Market Size, by Deployment Mode, 2020–2029 (USD Million)
Table 57 Germany: Blockchain in Retail Market Size, by Component, 2020–2029 (USD Million)
Table 58 Germany: Blockchain in Retail Market Size, by Application, 2020–2029 (USD Million)
Table 59 Germany: Blockchain in Retail Market Size, by Organization Size, 2020–2029 (USD Million)
Table 60 Germany: Blockchain in Retail Market Size, by Provider, 2020–2029 (USD Million)
Table 61 Germany: Blockchain in Retail Market Size, by Type, 2020–2029 (USD Million)
Table 62 Germany: Blockchain in Retail Market Size, by Deployment Mode, 2020–2029 (USD Million)
Table 63 U.K.: Blockchain in Retail Market Size, by Component, 2020–2029 (USD Million)
Table 64 U.K.: Blockchain in Retail Market Size, by Application, 2020–2029 (USD Million)
Table 65 U.K.: Blockchain in Retail Market Size, by Organization Size, 2020–2029 (USD Million)
Table 66 U.K.: Blockchain in Retail Market Size, by Provider, 2020–2029 (USD Million)
Table 67 U.K.: Blockchain in Retail Market Size, by Type, 2020–2029 (USD Million)
Table 68 U.K.: Blockchain in Retail Market Size, by Deployment Mode, 2020–2029 (USD Million)
Table 69 France: Blockchain in Retail Market Size, by Component, 2020–2029 (USD Million)
Table 70 France: Blockchain in Retail Market Size, by Application, 2020–2029 (USD Million)
Table 71 France: Blockchain in Retail Market Size, by Organization Size, 2020–2029 (USD Million)
Table 72 France: Blockchain in Retail Market Size, by Provider, 2020–2029 (USD Million)
Table 73 France: Blockchain in Retail Market Size, by Type, 2020–2029 (USD Million)
Table 74 France: Blockchain in Retail Market Size, by Deployment Mode, 2020–2029 (USD Million)
Table 75 Italy: Blockchain in Retail Market Size, by Component, 2020–2029 (USD Million)
Table 76 Italy: Blockchain in Retail Market Size, by Application, 2020–2029 (USD Million)
Table 77 Italy: Blockchain in Retail Market Size, by Organization Size, 2020–2029 (USD Million)
Table 78 Italy: Blockchain in Retail Market Size, by Provider, 2020–2029 (USD Million)
Table 79 Italy: Blockchain in Retail Market Size, by Type, 2020–2029 (USD Million)
Table 80 Italy: Blockchain in Retail Market Size, by Deployment Mode, 2020–2029 (USD Million)
Table 81 Spain: Blockchain in Retail Market Size, by Component, 2020–2029 (USD Million)
Table 82 Spain: Blockchain in Retail Market Size, by Application, 2020–2029 (USD Million)
Table 83 Spain: Blockchain in Retail Market Size, by Organization Size, 2020–2029 (USD Million)
Table 84 Spain: Blockchain in Retail Market Size, by Provider, 2020–2029 (USD Million)
Table 85 Spain: Blockchain in Retail Market Size, by Type, 2020–2029 (USD Million)
Table 86 Spain: Blockchain in Retail Market Size, by Deployment Mode, 2020–2029 (USD Million)
Table 87 Netherlands: Blockchain in Retail Market Size, by Component, 2020–2029 (USD Million)
Table 88 Netherlands: Blockchain in Retail Market Size, by Application, 2020–2029 (USD Million)
Table 89 Netherlands: Blockchain in Retail Market Size, by Organization Size, 2020–2029 (USD Million)
Table 90 Netherlands: Blockchain in Retail Market Size, by Provider, 2020–2029 (USD Million)
Table 91 Netherlands: Blockchain in Retail Market Size, by Type, 2020–2029 (USD Million)
Table 92 Netherlands: Blockchain in Retail Market Size, by Deployment Mode, 2020–2029 (USD Million)
Table 93 Switzerland: Blockchain in Retail Market Size, by Component, 2020–2029 (USD Million)
Table 94 Switzerland: Blockchain in Retail Market Size, by Application, 2020–2029 (USD Million)
Table 95 Switzerland: Blockchain in Retail Market Size, by Organization Size, 2020–2029 (USD Million)
Table 96 Switzerland: Blockchain in Retail Market Size, by Provider, 2020–2029 (USD Million)
Table 97 Switzerland: Blockchain in Retail Market Size, by Type, 2020–2029 (USD Million)
Table 98 Switzerland: Blockchain in Retail Market Size, by Deployment Mode, 2020–2029 (USD Million)
Table 99 Rest of Europe: Blockchain in Retail Market Size, by Component, 2020–2029 (USD Million)
Table 100 Rest of Europe: Blockchain in Retail Market Size, by Application, 2020–2029 (USD Million)
Table 101 Rest of Europe: Blockchain in Retail Market Size, by Organization Size, 2020–2029 (USD Million)
Table 102 Rest of Europe: Blockchain in Retail Market Size, by Provider, 2020–2029 (USD Million)
Table 103 Rest of Europe: Blockchain in Retail Market Size, by Type, 2020–2029 (USD Million)
Table 104 Rest of Europe: Blockchain in Retail Market Size, by Deployment Mode, 2020–2029 (USD Million)
Table 105 Asia-Pacific: Blockchain in Retail Market Size, by Country/Region, 2020–20212 (USD Million)
Table 106 Asia-Pacific: Blockchain in Retail Market Size, by Component, 2020–2029 (USD Million)
Table 107 Asia-Pacific: Blockchain in Retail Market Size, by Application, 2020–2029 (USD Million)
Table 108 Asia-Pacific: Blockchain in Retail Market Size, by Organization Size, 2020–2029 (USD Million)
Table 109 Asia-Pacific: Blockchain in Retail Market Size, by Provider, 2020–2029 (USD Million)
Table 110 Asia-Pacific: Blockchain in Retail Market Size, by Type, 2020–2029 (USD Million)
Table 111 Asia-Pacific: Blockchain in Retail Market Size, by Deployment Mode, 2020–2029 (USD Million)
Table 112 China: Blockchain in Retail Market Size, by Component, 2020–2029 (USD Million)
Table 113 China: Blockchain in Retail Market Size, by Application, 2020–2029 (USD Million)
Table 114 China: Blockchain in Retail Market Size, by Organization Size, 2020–2029 (USD Million)
Table 115 China: Blockchain in Retail Market Size, by Provider, 2020–2029 (USD Million)
Table 116 China: Blockchain in Retail Market Size, by Type, 2020–2029 (USD Million)
Table 117 China: Blockchain in Retail Market Size, by Deployment Mode, 2020–2029 (USD Million)
Table 118 Japan: Blockchain in Retail Market Size, by Component, 2020–2029 (USD Million)
Table 119 Japan: Blockchain in Retail Market Size, by Application, 2020–2029 (USD Million)
Table 120 Japan: Blockchain in Retail Market Size, by Organization Size, 2020–2029 (USD Million)
Table 121 Japan: Blockchain in Retail Market Size, by Provider, 2020–2029 (USD Million)
Table 122 Japan: Blockchain in Retail Market Size, by Type, 2020–2029 (USD Million)
Table 123 Japan: Blockchain in Retail Market Size, by Deployment Mode, 2020–2029 (USD Million)
Table 124 India: Blockchain in Retail Market Size, by Component, 2020–2029 (USD Million)
Table 125 India: Blockchain in Retail Market Size, by Application, 2020–2029 (USD Million)
Table 126 India: Blockchain in Retail Market Size, by Organization Size, 2020–2029 (USD Million)
Table 127 India: Blockchain in Retail Market Size, by Provider, 2020–2029 (USD Million)
Table 128 India: Blockchain in Retail Market Size, by Type, 2020–2029 (USD Million)
Table 129 India: Blockchain in Retail Market Size, by Deployment Mode, 2020–2029 (USD Million)
Table 130 South Korea: Blockchain in Retail Market Size, by Component, 2020–2029 (USD Million)
Table 131 South Korea: Blockchain in Retail Market Size, by Application, 2020–2029 (USD Million)
Table 132 South Korea: Blockchain in Retail Market Size, by Organization Size, 2020–2029 (USD Million)
Table 133 South Korea: Blockchain in Retail Market Size, by Provider, 2020–2029 (USD Million)
Table 134 South Korea: Blockchain in Retail Market Size, by Type, 2020–2029 (USD Million)
Table 135 South Korea: Blockchain in Retail Market Size, by Deployment Mode, 2020–2029 (USD Million)
Table 136 Singapore: Blockchain in Retail Market Size, by Component, 2020–2029 (USD Million)
Table 137 Singapore: Blockchain in Retail Market Size, by Application, 2020–2029 (USD Million)
Table 138 Singapore: Blockchain in Retail Market Size, by Organization Size, 2020–2029 (USD Million)
Table 139 Singapore: Blockchain in Retail Market Size, by Provider, 2020–2029 (USD Million)
Table 140 Singapore: Blockchain in Retail Market Size, by Type, 2020–2029 (USD Million)
Table 141 Singapore: Blockchain in Retail Market Size, by Deployment Mode, 2020–2029 (USD Million)
Table 142 Rest of Asia-Pacific: Blockchain in Retail Market Size, by Component, 2020–2029 (USD Million)
Table 143 Rest of Asia-Pacific: Blockchain in Retail Market Size, by Application, 2020–2029 (USD Million)
Table 144 Rest of Asia-Pacific: Blockchain in Retail Market Size, by Organization Size, 2020–2029 (USD Million)
Table 145 Rest of Asia-Pacific: Blockchain in Retail Market Size, by Provider, 2020–2029 (USD Million)
Table 146 Rest of Asia-Pacific: Blockchain in Retail Market Size, by Type, 2020–2029 (USD Million)
Table 147 Rest of Asia-Pacific: Blockchain in Retail Market Size, by Deployment Mode, 2020–2029 (USD Million)
Table 148 Latin America: Blockchain in Retail Market Size, by Country/Region, 2020–20212 (USD Million)
Table 149 Latin America: Blockchain in Retail Market Size, by Component, 2020–2029 (USD Million)
Table 150 Latin America: Blockchain in Retail Market Size, by Application, 2020–2029 (USD Million)
Table 151 Latin America: Blockchain in Retail Market Size, by Organization Size, 2020–2029 (USD Million)
Table 152 Latin America: Blockchain in Retail Market Size, by Provider, 2020–2029 (USD Million)
Table 153 Latin America: Blockchain in Retail Market Size, by Type, 2020–2029 (USD Million)
Table 154 Latin America: Blockchain in Retail Market Size, by Deployment Mode, 2020–2029 (USD Million)
Table 155 Mexico: Blockchain in Retail Market Size, by Component, 2020–2029 (USD Million)
Table 156 Mexico: Blockchain in Retail Market Size, by Application, 2020–2029 (USD Million)
Table 157 Mexico: Blockchain in Retail Market Size, by Organization Size, 2020–2029 (USD Million)
Table 158 Mexico: Blockchain in Retail Market Size, by Provider, 2020–2029 (USD Million)
Table 159 Mexico: Blockchain in Retail Market Size, by Type, 2020–2029 (USD Million)
Table 160 Mexico: Blockchain in Retail Market Size, by Deployment Mode, 2020–2029 (USD Million)
Table 161 Brazil: Blockchain in Retail Market Size, by Component, 2020–2029 (USD Million)
Table 162 Brazil: Blockchain in Retail Market Size, by Application, 2020–2029 (USD Million)
Table 163 Brazil: Blockchain in Retail Market Size, by Organization Size, 2020–2029 (USD Million)
Table 164 Brazil: Blockchain in Retail Market Size, by Provider, 2020–2029 (USD Million)
Table 165 Brazil: Blockchain in Retail Market Size, by Type, 2020–2029 (USD Million)
Table 166 Brazil: Blockchain in Retail Market Size, by Deployment Mode, 2020–2029 (USD Million)
Table 167 Rest of Latin America: Blockchain in Retail Market Size, by Component, 2020–2029 (USD Million)
Table 168 Rest of Latin America: Blockchain in Retail Market Size, by Application, 2020–2029 (USD Million)
Table 169 Rest of Latin America: Blockchain in Retail Market Size, by Organization Size, 2020–2029 (USD Million)
Table 170 Rest of Latin America: Blockchain in Retail Market Size, by Provider, 2020–2029 (USD Million)
Table 171 Rest of Latin America: Blockchain in Retail Market Size, by Type, 2020–2029 (USD Million)
Table 172 Rest of Latin America: Blockchain in Retail Market Size, by Deployment Mode, 2020–2029 (USD Million)
Table 173 Middle East & Africa: Blockchain in Retail Market Size, by Country/Region, 2020–20212 (USD Million)
Table 174 Middle East & Africa: Blockchain in Retail Market Size, by Component, 2020–2029 (USD Million)
Table 175 Middle East & Africa: Blockchain in Retail Market Size, by Application, 2020–2029 (USD Million)
Table 176 Middle East & Africa: Blockchain in Retail Market Size, by Organization Size, 2020–2029 (USD Million)
Table 177 Middle East & Africa: Blockchain in Retail Market Size, by Provider, 2020–2029 (USD Million)
Table 178 Middle East & Africa: Blockchain in Retail Market Size, by Type, 2020–2029 (USD Million)
Table 179 Middle East & Africa: Blockchain in Retail Market Size, by Deployment Mode, 2020–2029 (USD Million)
Table 180 UAE: Blockchain in Retail Market Size, by Component, 2020–2029 (USD Million)
Table 181 UAE: Blockchain in Retail Market Size, by Application, 2020–2029 (USD Million)
Table 182 UAE: Blockchain in Retail Market Size, by Organization Size, 2020–2029 (USD Million)
Table 183 UAE: Blockchain in Retail Market Size, by Provider, 2020–2029 (USD Million)
Table 184 UAE: Blockchain in Retail Market Size, by Type, 2020–2029 (USD Million)
Table 185 UAE: Blockchain in Retail Market Size, by Deployment Mode, 2020–2029 (USD Million)
Table 186 Israel: Blockchain in Retail Market Size, by Component, 2020–2029 (USD Million)
Table 187 Israel: Blockchain in Retail Market Size, by Application, 2020–2029 (USD Million)
Table 188 Israel: Blockchain in Retail Market Size, by Organization Size, 2020–2029 (USD Million)
Table 189 Israel: Blockchain in Retail Market Size, by Provider, 2020–2029 (USD Million)
Table 190 Israel: Blockchain in Retail Market Size, by Type, 2020–2029 (USD Million)
Table 191 Israel: Blockchain in Retail Market Size, by Deployment Mode, 2020–2029 (USD Million)
Table 192 Rest of Middle East & Africa: Blockchain in Retail Market Size, by Component, 2020–2029 (USD Million)
Table 193 Rest of Middle East & Africa: Blockchain in Retail Market Size, by Application, 2020–2029 (USD Million)
Table 194 Rest of Middle East & Africa: Blockchain in Retail Market Size, by Organization Size, 2020–2029 (USD Million)
Table 195 Rest of Middle East & Africa: Blockchain in Retail Market Size, by Provider, 2020–2029 (USD Million)
Table 196 Rest of Middle East & Africa: Blockchain in Retail Market Size, by Type, 2020–2029 (USD Million)
Table 197 Rest of Middle East & Africa: Blockchain in Retail Market Size, by Deployment Mode, 2020–2029 (USD Million)
List of Figures
Figure 1 Research Process
Figure 2 Key Secondary Sources
Figure 3 Primary Research Techniques
Figure 4 Key Executives Interviewed
Figure 5 Breakdown of Primary Interviews (Supply-side & Demand-side)
Figure 6 Market Sizing & Growth Forecast Approach
Figure 7 Key Insights
Figure 8 The Solutions Segment to Dominate the Global Blockchain in Retail Market, by Component (2020–2029)
Figure 9 The Supply Chain Management Segment to Dominate the Global Blockchain in Retail Market, by Application (2020–2029)
Figure 10 The Large Enterprises Segment to Dominate the Global Blockchain in Retail Market, by Organization Size (2020–2029)
Figure 11 The Middleware Provider Segment to Dominate the Global Blockchain in Retail Market, by Provider (2020–2029)
Figure 12 The Public Blockchain Segment to Dominate the Global Blockchain in Retail Market, by Type (2020–2029)
Figure 13 The Cloud-based Deployment Segment to Dominate the Global Blockchain in Retail Market, by Deployment Mode (2020–2029)
Figure 14 Blockchain in Retail Market, by Region
Figure 15 Market Dynamics
Figure 16 Global Blockchain in Retail Market Size, by Component, 2022 VS. 2029 (USD Million)
Figure 17 Global Blockchain in Retail Market Size, by Application, 2022 VS. 2029 (USD Million)
Figure 18 Global Blockchain in Retail Market Size, by Organization Size, 2022 VS. 2029 (USD Million)
Figure 19 Global Blockchain in Retail Market Size, by Provider, 2022 VS. 2029 (USD Million)
Figure 20 Global Blockchain in Retail Market Size, by Type, 2022 VS. 2029 (USD Million)
Figure 21 Global Blockchain in Retail Market Size, by Deployment Mode, 2022 VS. 2029 (USD Million)
Figure 22 Global Blockchain in Retail Market Size, by Geography, 2022 VS. 2029 (USD Million)
Figure 23 North America Blockchain in Retail Market: Snapshot
Figure 24 Europe Blockchain in Retail Market: Snapshot
Figure 25 Asia-Pacific Blockchain in Retail Market: Snapshot
Figure 26 Latin America Blockchain in Retail Market: Snapshot
Figure 27 Middle East & Africa Blockchain in Retail Market: Snapshot
Figure 28 Key Growth Strategies Adopted by Key Players, 2020-2022
Figure 29 Mergers & Acquisitions
Figure 30 Global Blockchain in Retail Market Share Analysis, by Key Players, 2021
Figure 31 IBM Corporation: Financial Overview (2019-2021)
Figure 32 SAP SE: Financial Overview (2019-2021)
Figure 33 Microsoft Corporation: Financial Overview (2019-2021)
Figure 34 Oracle Corporation: Financial Overview (2019-2021)
Figure 35 Amazon Web Services, Inc.: Financial Overview (2019-2021)
Figure 36 Infosys Limited: Financial Overview (2019-2021)
Figure 37 Cognizant Technology Solutions Corporation: Financial Overview (2019-2021)
Figure 38 Tata Consultancy Services Limited: Financial Overview (2019-2021)
Figure 39 Coinbase, Inc.: Financial Overview (2019-2021)
Figure 40 Reply: Financial Overview (2019-2021)
Figure 41 Blockchain Foundry inc.: Financial Overview (2019-2021)
Figure 42 Cisco Systems, Inc.: Financial Overview (2019-2021)