
Business Intelligence Market (2042-2032)
The Business Intelligence Market was valued at $29.9 billion in 2024. This market is expected to reach $56.9 billion by 2032 from an estimated $32.3 billion in 2025, at a CAGR of 7.2% during the forecast period of 2025-2032. Business Intelligence Market Size & Forecast The growth of this market is
- Published
- Jan 2025
- Pages
- 280
- Format
- PDF + Excel
- Report ID
- MR-728
- Base year
- 2024
- 2024 · BASELINE
- $29.90B
- 2032
- $56.90B
- CAGR 2025–2032
- 7.2%
2024 baseline · 2025–2032 forecast at 7.2% CAGR · hover a bar for the value
Key highlights
By Component: in 2025, the Solutions/Tools Segment is Expected to Dominate the Business Intelligence Market
By Organization Size: in 2025, the Large Enterprises Segment is Expected to Dominate the Business Intelligence Market
By Deployment Mode: in 2025, the Cloud-based Segment is Expected to Dominate the Business Intelligence Market
By Business Function: in 2025, the Sales & Marketing Segment is Expected to Dominate the Business Intelligence Market
By End-use Industry: in 2025, the BFSI Segment is Expected to Dominate the Business Intelligence Market
By Geography: North America to Dominate Business Intelligence Market in 2025
Report summary
| Particulars | Details |
|---|---|
| Number of Pages | 280 |
| Format | |
| Forecast Period | 2025–2032 |
| Base Year | 2024 |
| CAGR (Value) | 7.2% |
| Market Size (Value) | USD 56.9 Billion by 2032 |
| Segments Covered | By Component · Solutions/Tools · Spreadsheets · Data Visualization Tools · Data Mining Tools · Querying Tools · Performance Management Tools · Online analytical processing (OLAP) · Other Solutions/Tools · Services · Consulting Services · Implementation Services · Training and Support Services · By Organization Size · Large Enterprises · Small & Medium-sized Enterprises · By Deployment Mode · On-premise · Cloud-based · By Business Function · Human Resource · Finance · Operations · Sales & Marketing · By End-use Industry · Retail & E-commerce · Manufacturing · BFSI · Healthcare & Life Sciences · Education · IT & Telecommunications · Energy & Utilities · Media & Entertainment · Transportation & Logistics · Hospitality & Tourism · Other End-use Industry |
| Countries Covered | North America (U.S., Canada), Europe (Germany, U.K., France, Italy, Spain, Netherlands, Switzerland, Sweden, and Rest of Europe), Asia-Pacific (China, Japan, India, South Korea, Australia & New Zealand, Indonesia, Singapore, and Rest of Asia-Pacific), Latin America (Brazil, Mexico, and Rest of Latin America), and the Middle East & Africa (UAE, Saudi Arabia, South Africa, Israel, and Rest of Middle East & Africa) |
| Key Companies | Oracle Corporation (U.S.), IBM Corporation (U.S.), Microsoft Corporation (U.S.), SAP SE (Germany), Qlik Technologies Inc. (U.S.), SAS Institute Inc.(U.S.), TIBCO Software Inc. (U.S.), Amlgo Labs Pvt Ltd (India), Salesforce, Inc. (U.S.), Google LLC (A Subsidiary of Alphabet Inc.) (U.S.), Cisco Systems, Inc. (U.S.), Element Data (U.S.), Board International SA (Switzerland), MicroStrategy Incorporated (U.S.), and Hitachi Vantara LLC (A Subsidiary of Hitachi, Ltd.) (U.S.) |
Report overview
Segments covered: component, organization size, deployment mode, business function, end-use industry. Regions: North America, Europe, Asia-Pacific, Latin America, Middle East & Africa.
The growth of this market is driven by rising demand for data visualization dashboards for making informed business decisions and a surge in demand for cloud business intelligence applications. Furthermore, the growing need for business intelligence in human resources and the rising demand for embedded analytics in organizations are expected to generate growth opportunities for the stakeholders in this market.
Market dynamics
3 factors across 2 forcesIncreasing Demand for Data Visualization Dashboards to Support Informed Business Decisions
In recent years, many businesses have been utilizing data visualization tools to simplify the viewing and understanding of trends, outliers, and patterns by employing visual elements such as charts, graphs, and maps. Data visualization dashboards present real-time data by extracting complex data points from large datasets. Additionally, these visualization and dashboard creation tools enable users to analyze data and communicate insights quickly and intuitively, catering to both experienced data analysts and casual business users, often without the need for coding. They also assist in preparing, securing, and governing data for data warehouses, analytics, and various business applications.
Furthermore, a data visualization dashboard enables digital marketers to track multiple data sources and visualize the data, providing a robust dataset for decision-makers. Several organizations are launching data visualization solutions to enhance business operations. For example, in September 2022, AdvisorEngine Inc. (U.S.) introduced new data visualization dashboards that offer insights tailored to specific roles within key wealth management areas. These dashboards include features such as ‘drag-and-drop’ customization, in-line editing, automatic data population, advanced filtering, one-click drill-down to detailed data, and enterprise permissions to manage information access. As a result, the increasing demand for data visualization tools to facilitate informed business decisions is driving the demand for business intelligence solutions, thereby promoting market growth.
Surge in Demand for Cloud Business Intelligence Applications
The increasing technological advancements that allow organizations to scale their resources based on demand are driving the growth of cloud-based business intelligence solutions. Organizations are increasingly utilizing the latest analytics tools and features without the need to upgrade on-premises systems. The adoption of cloud-based BI solutions has risen as they operate on a subscription model, minimizing the upfront costs associated with hardware and software purchases. Additionally, the growing trend of remote work is fueling demand for cloud BI applications, enabling access from anywhere with an internet connection across various teams.
Additionally, cloud BI applications integrate advanced analytics tools that leverage AI and machine learning, enabling deeper insights and predictive capabilities. As the adoption of cloud-based BI solutions continues to rise, several providers are launching new offerings for organizations. For example, in October 2025, Everon, LLC (U.S.) introduced Mavn BI, Onepoint, and Sightline Brands, which focus on intelligence-driven video solutions and an account management suite. Everon’s cloud-based software portal serves as a single point of access for commercial customers, linking critical business insights from Mavn BI and Sightline video solutions in one comprehensive destination. Such developments are expected to further drive the growth of cloud-based BI solutions during the forecast period.
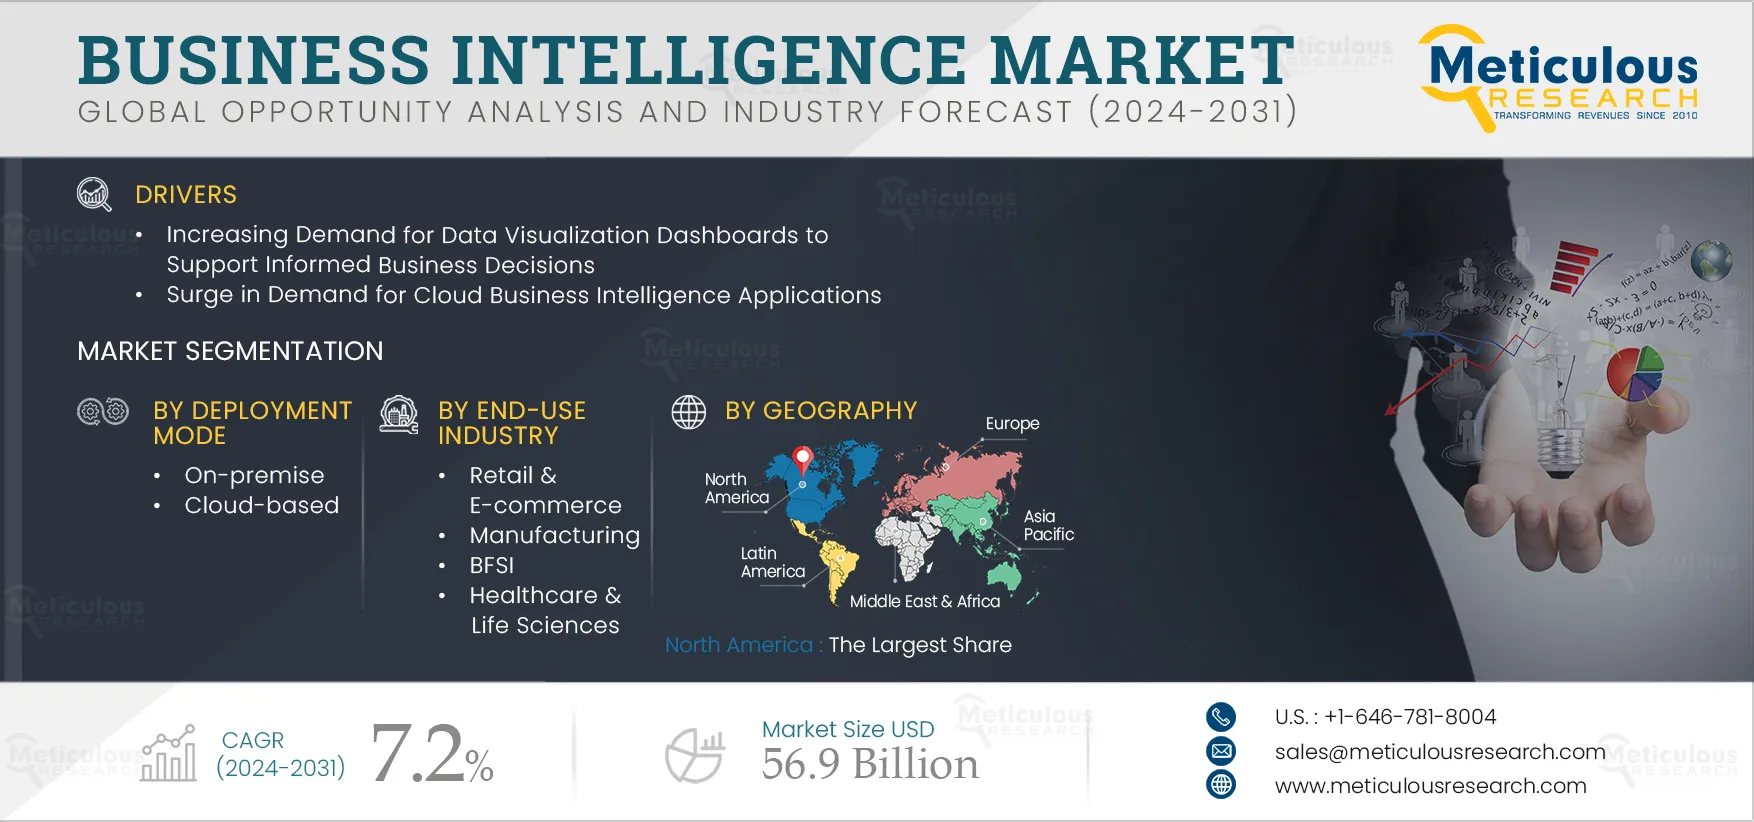
Table of contents
13 chapters · 141 sections · 280 pages · click to expandSegmental analysis
| Segment | Largest share (2025) | Fastest growth (2025–2032) |
|---|---|---|
| By Component | Solutions/Tools | — |
By Component
- The solutions/tools segment is estimated to account for the larger share of the business intelligence market.
- The large share of this segment is attributed to the increasing adoption of BI solutions and tools that provide actionable insights through data analysis, enabling informed decision-making.
- Additionally, the rising use of BI solutions for sharing reports and dashboards is enhancing communication and alignment across departments.
- Business intelligence solutions encompass a range of tools and technologies designed to assist organizations in collecting, analyzing, and visualizing data to facilitate informed decision-making.
- These solutions include data visualization tools that feature interactive dashboards, customizable reports, real-time data visualization, and user-friendly drag-and-drop interfaces.
- Several types of business intelligence tools are available, such as reporting tools, data warehousing solutions, predictive analytics tools, and data integration tools.
- These BI solutions cater to the specific needs of different organizations, enabling them to leverage data effectively to drive better decision-making, improve operational efficiency, and enhance overall business performance.
Geographic analysis
North America
Largest shareIn 2025, North America is estimated to account for the largest share of the business intelligence market. This large share is primarily attributed to the region's emerging technologies and rapid developments in automation and digitization, increasing demand for business intelligence solutions for the banking and finance sector in the region, and rising development by key players in North America in business intelligence. North America Dominates the Business Intelligence Market in 2025
Asia-Pacific
Fastest growthHowever, Asia-Pacific is slated to register the highest CAGR during the forecast period. This market's growth is driven by several factors, including the increasing adoption of advanced technologies in countries such as China, Japan, and India, the rising demand for business intelligence solutions in the retail and e-commerce sectors, and the growing need for data visualization dashboards to support informed business decision-making.
Competitive landscape
- June 2025
Databricks, Inc. (U.S.) launched Genie, an artificial intelligence (AI)- powered business intelligence (BI) product designed to enable anyone in an organization to access analytics and insights.
- July 2024
HCL Technologies Limited (India), a leading global technology company, launched HCLTech Advantage Analytics, an AI-powered business intelligence solution. This solution leverages Snowflake’s Data Cloud to provide enterprises with a range of services by integrating artificial intelligence (AI) with business intelligence (BI), enhancing customer experiences and business outcomes.
- 2022
LYTT Limited (U.K.) released an upgraded version of its data visualization dashboard, spotLYTT™ version 2. This tool offers Oil & Gas operators an enhanced user experience and enables powerful multi-channel analyses, allowing them to manage multiple projects simultaneously.
- 2022
Oracle Corporation (U.S.) launched its Oracle Cloud Infrastructure (OCI) Dashboards service. This service allows customers to gain insights, observe trends, and diagnose issues from a specific location within the Oracle Cloud Console.
- Oracle Corporation (U.S.)
- IBM Corporation (U.S.)
- Microsoft Corporation (U.S.)
- SAP SE · Germany
- Qlik Technologies Inc. (U.S.)
- SAS Institute Inc.(U.S.)
- TIBCO Software Inc. (U.S.)
- Amlgo Labs Pvt Ltd · India
- Salesforce, Inc. (U.S.)
- Cisco Systems, Inc. (U.S.)
- Element Data (U.S.)
- Board International SA · Switzerland
- MicroStrategy Incorporated (U.S.)
Frequently asked questions
The business intelligence market size was valued at $29.9 billion in 2024.
Cite this report
Meticulous Research. (2025). Business Intelligence Market - Global Opportunity Analysis And Industry Forecast (2042-2032) (Report No. MR-728). Meticulous Market Research Pvt. Ltd. https://www.meticulousresearch.com/product/business-intelligence-market-5412